Reporting Fatigue: Team Load and Solutions
Too many reports wear a team out: nobody knows which one to look at. We cover a report inventory, shared definitions and alert-focused dashboards.
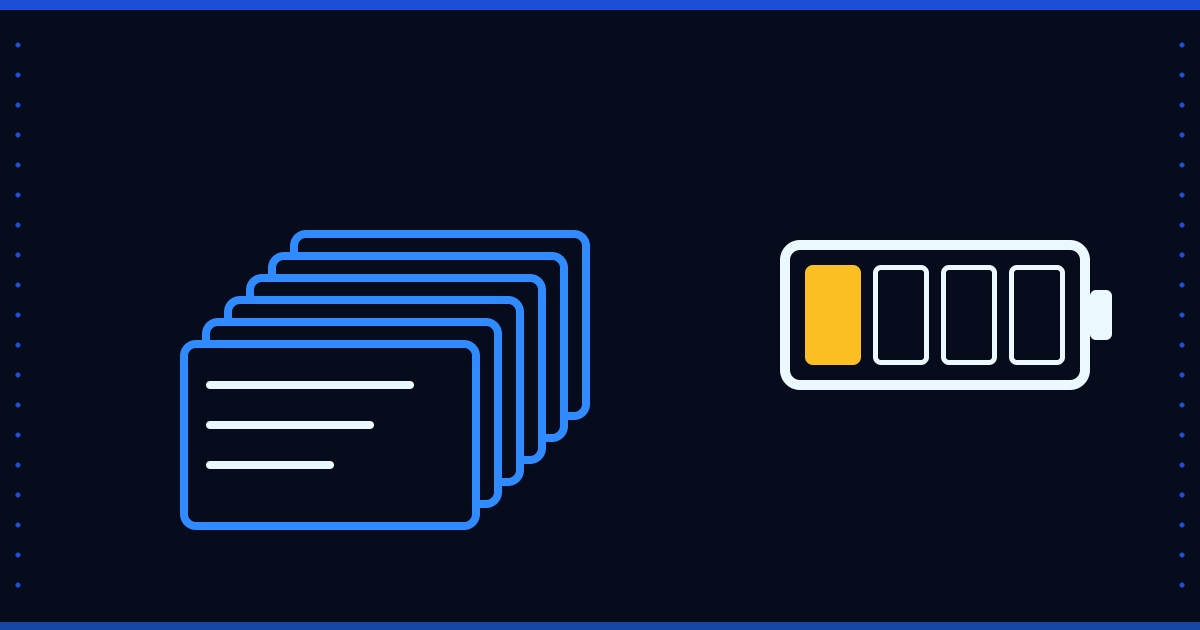
A company has dozens of reports, yet it is unclear which one to open to answer a question. Reporting fatigue is the state in which many reports overwhelm people instead of informing them.
Symptoms
- There are several reports for the same question and the numbers do not match.
- Nobody knows which one is correct.
- Reports are opened but not read.
- Every new request means a new report.
Why does it build up?
The cause is often report-variant inflation: derivatives of the same report by warehouse, by batch or by a different valuation method are developed separately, and dozens of queries that are derivatives of each other pile up. Each one is reasonable on its own; together they cannot be managed.
Solutions
- Build a report inventory: which report is opened by whom and how often? Close the ones that are not used.
- Shared definitions: define a measure in one place; two reports should not calculate the same thing with two different formulas.
- Make variants parameters, not developments: let a warehouse or period difference be a filter instead of a new report.
- Work by exception: a view that stays quiet normally and speaks up when there is a deviation beats scanning every report.
- One-page summary: a single summary of at most five indicators for the weekly meeting.
A fictional example
The following example is fictional. A company builds an inventory and finds that only 12 of 40 reports were opened in the last three months. Some of the rest are copies of the same measure with different filters. The company reduces them to a few reports with filter options.
Where Floemdata stands
The project documentation of Floemdata Analytics defines the core problem it aims to solve as report-variant inflation; the goal is to reduce the demand for variants to a definition that needs no new development. This goal is pursued through the measure and dimension catalog and a single compiler; the dashboard's company summary view is computed outside that path with its own query, and that the two paths give the same result has not been measured yet (not verified). The dashboard contains core reports. The product code contains anomaly rules and alert records; whether they are presented in the panel as an alert-focused view is not verified in this article (not verified).
To get started, list the five reports opened most and the five never opened this week. Questions: info@floemdata.com.