
BI & Reporting
NULL Values Silently Shift Report Totals
NULL is not zero. It quietly shifts averages, counts and joins in reports. How to spot it, how to handle it, and where Floemdata stands today.
Business intelligence and reporting explained plainly: Power BI, dashboards, the semantic layer, and what makes a report number something people can rely on.
NULL is not zero. It quietly shifts averages, counts and joins in reports. How to spot it, how to handle it, and where Floemdata stands today.
Why old numbers stop matching when a report definition changes. Version numbers, change notes and a transition period to manage report changes; Floemdata status.

A correct number is not enough: the team must read the report correctly. Five short habits on period, definition, freshness and comparison; Floemdata's status.
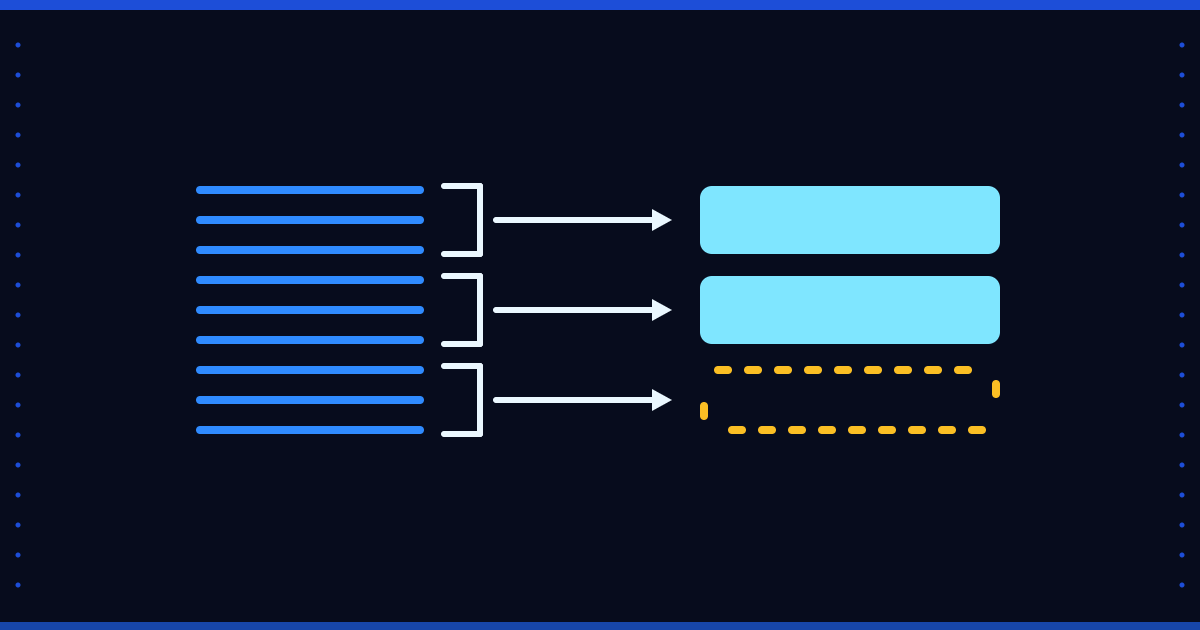
A slow report often re-sums raw rows on every open. How pre-aggregated tables work, what freshness costs, and what Floemdata does and does not have today.
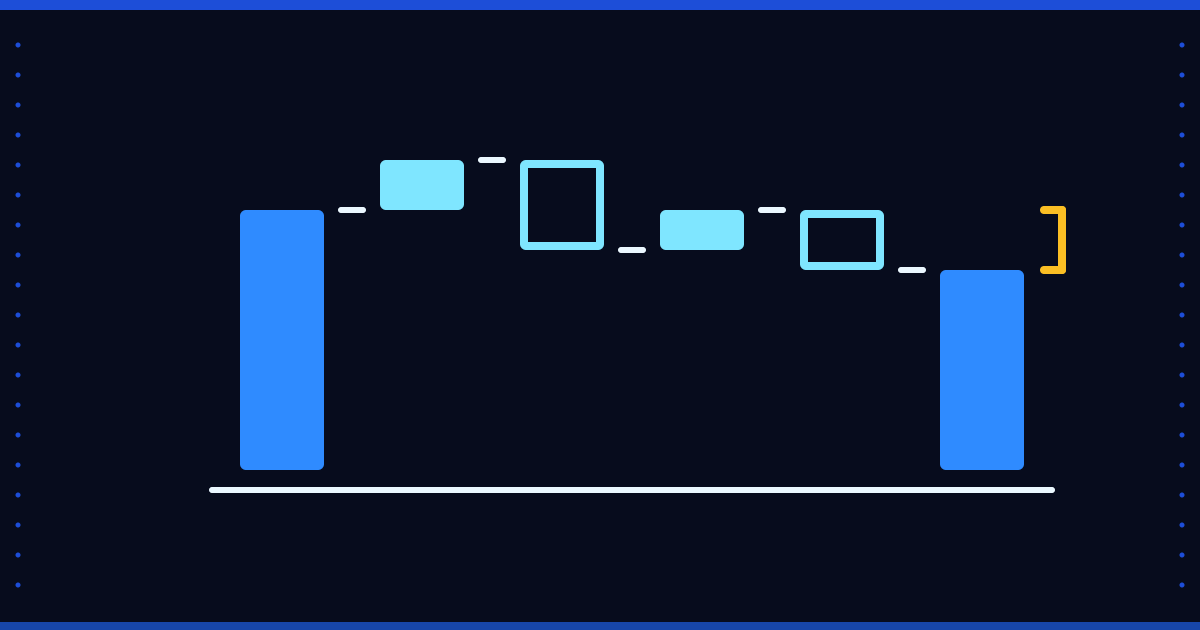
The gap between budget and actual says little on its own. Sign rules, the percentage trap, price and volume splitting, and where Floemdata stands on budgets today.

Inventory turnover and ageing ask the same question in two ways. Formula choices, average-stock and days-idle traps, and the definitions Floemdata actually uses.
Two reports, two revenue figures: the definition is the problem. A KPI glossary with one definition, one owner and version notes, and Floemdata's measure catalog.

From gross to net sales: how returns and cancelled documents distort the number, checks that prevent double counting, and Floemdata's real status.

What does splitting open receivables into overdue buckets show, and what does it hide? How to read the buckets, common mistakes and Floemdata's ageing table.
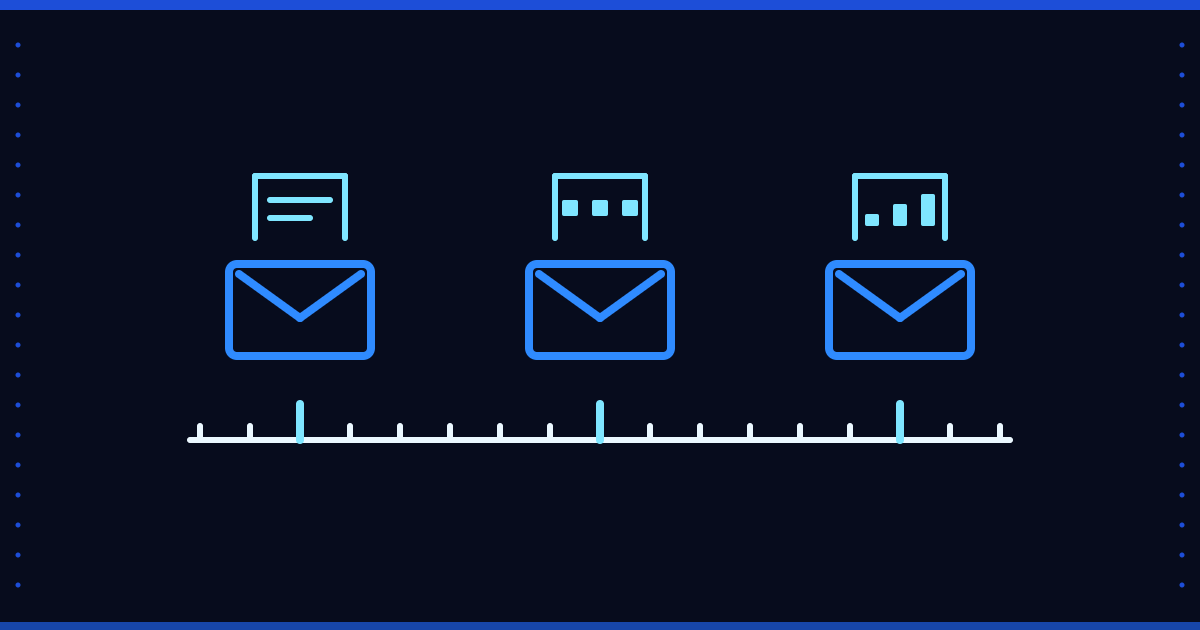
Every morning, or only when needed? Recipient, timing, format and data-freshness decisions behind scheduled delivery, and where Floemdata stands.

A live query is accurate but slow, a cache is fast but can be stale. We cover the balance between speed and accuracy and when caching is safe.
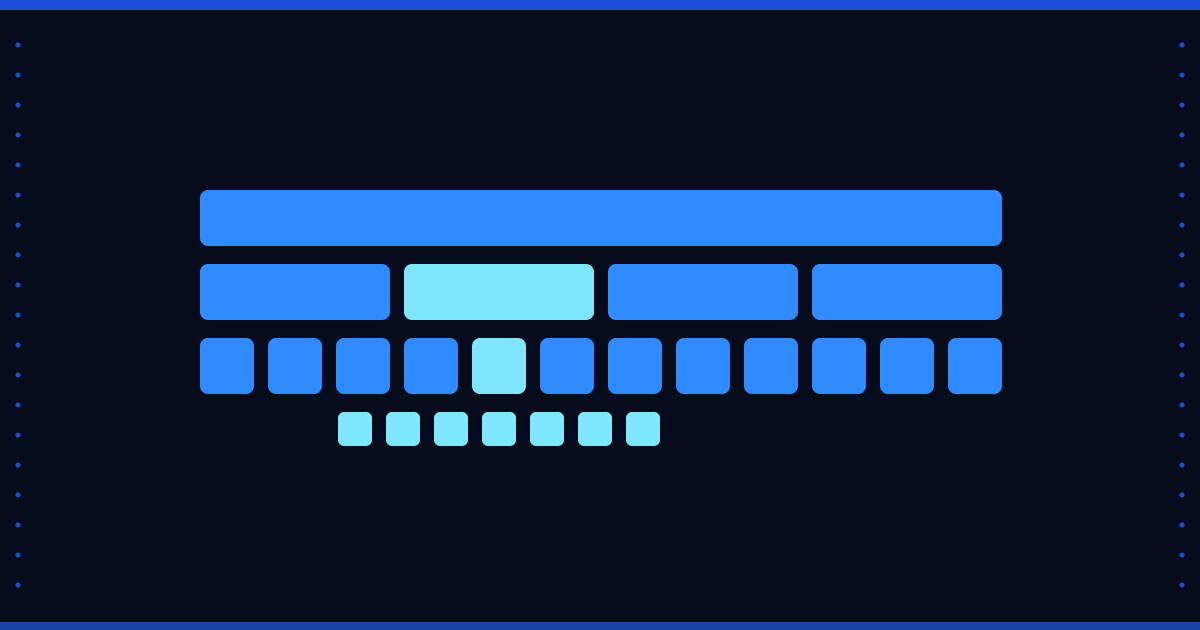
Should a report's date dimension be day, hour or minute? We explain how granularity, time zones and calendar differences change a number.

Excel is flexible, a system report is consistent; which is right when? We compare version chaos, formula errors and a single source of truth.

Drilling from summary to detail speeds up a BI dashboard. We cover design principles and what to watch when choosing the order of dimensions.
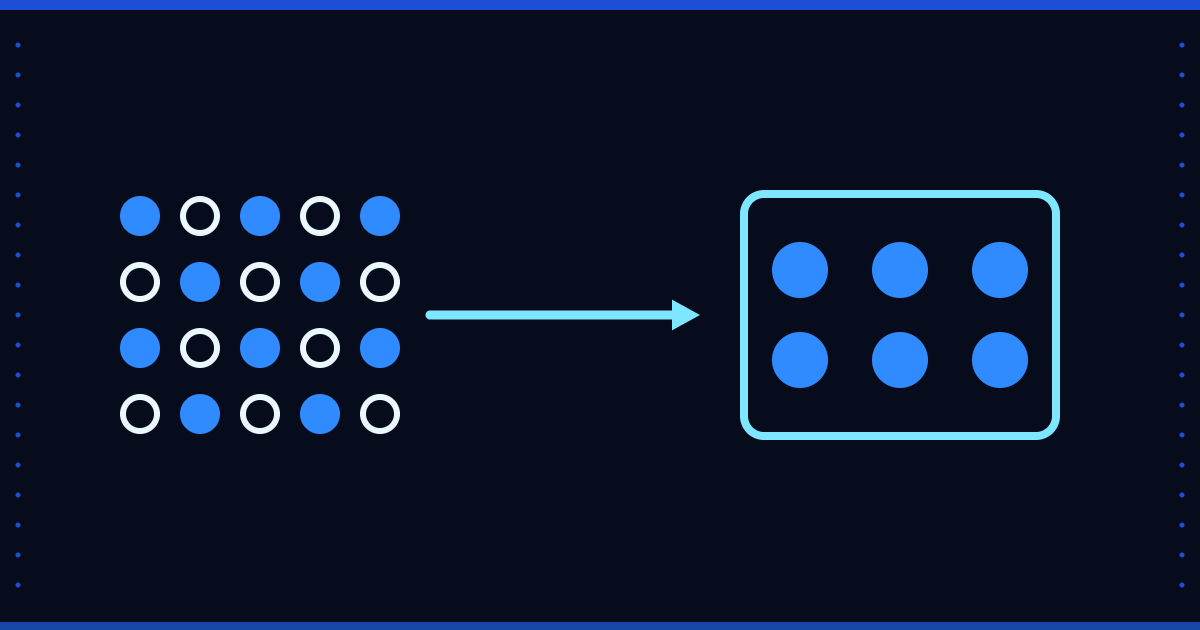
Reports can mislead even with correct numbers: Simpson's paradox, truncated axes, averaged ratios. We cover common traps with fictional examples.

Too many reports wear a team out: nobody knows which one to look at. We cover a report inventory, shared definitions and alert-focused dashboards.
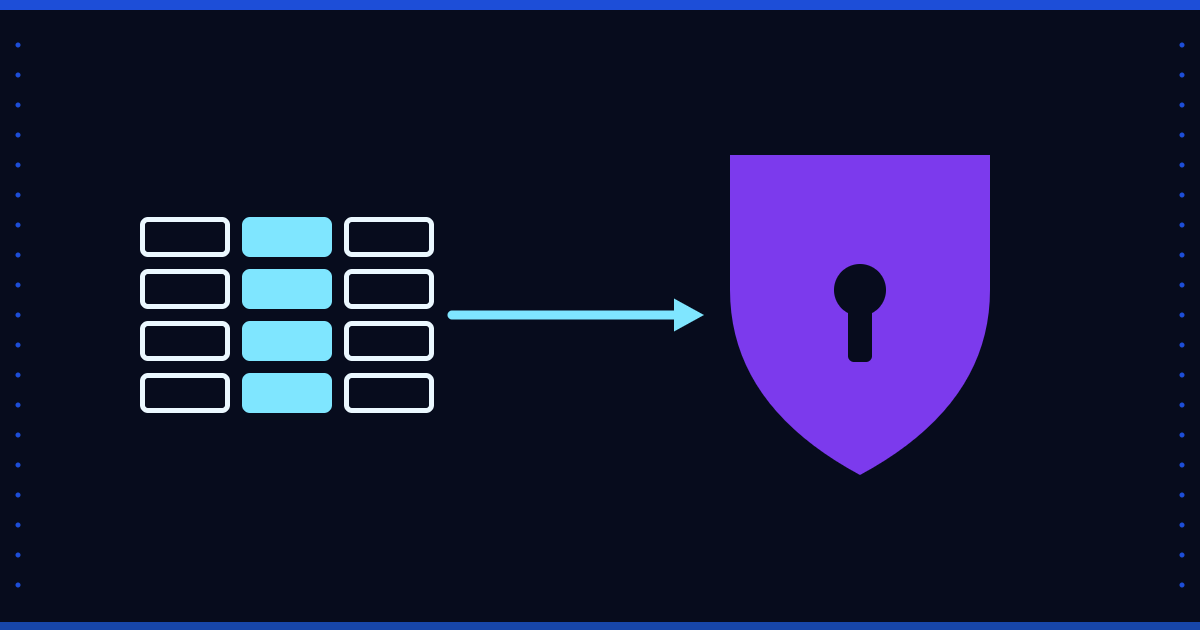
Personal data in BI reports should be considered under Turkish KVKK. We explain the data security duty and access-rule design. Not legal advice.

A BI measure should be defined once, in one place: sums, ratios, time dimensions and filters. We explain the catalog approach and traps such as working days.
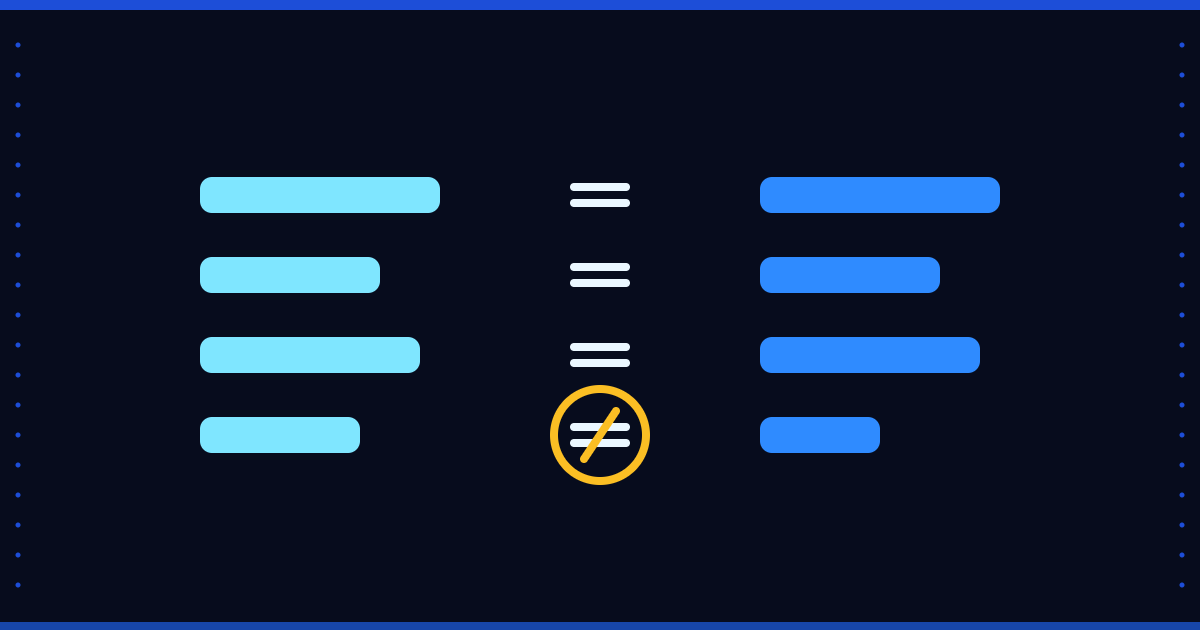
Does the report match the source system? We describe a two-layer reconciliation and why a difference should be shown, not hidden.
What business intelligence means, how it differs from plain reporting, the usual stack, and why the semantic layer decides if dashboards can be trusted.
Power BI components, Import versus DirectQuery, where the data model should come from, and why connecting it straight to your ERP tends to backfire.