Featured
AIAI-Written Report Summaries: Accuracy Risks
Letting a language model summarise a report saves time but risks invented commentary and wrong figures. Ways to limit the risk and Floemdata's stated principle.
Plain explanations of the systems and concepts behind the product.
Letting a language model summarise a report saves time but risks invented commentary and wrong figures. Ways to limit the risk and Floemdata's stated principle.

How the cent gap between line rounding and document rounding shows up in totals and how to track it. A small example and the rounding difference field in Floemdata.
How to extract from a running ERP without slowing it: off-hours first load, reading in batches, pauses, timeouts and a read-only user. Floemdata's documented rules.
A one-to-many join duplicates rows and inflates totals. How to spot the fan-out and prevent it, with an invoice and payments example and Floemdata's status.
Where do labels for supervised learning come from? Inconsistent labels, small data and steps to set up labeling at SME scale; Floemdata's real status.
NULL is not zero. It quietly shifts averages, counts and joins in reports. How to spot it, how to handle it, and where Floemdata stands today.
Why old numbers stop matching when a report definition changes. Version numbers, change notes and a transition period to manage report changes; Floemdata status.
A correct number is not enough: the team must read the report correctly. Five short habits on period, definition, freshness and comparison; Floemdata's status.
When a customer's region changes, past reports must not shift. Type 1 versus Type 2 for slowly changing dimensions, how to choose, and Floemdata's status.
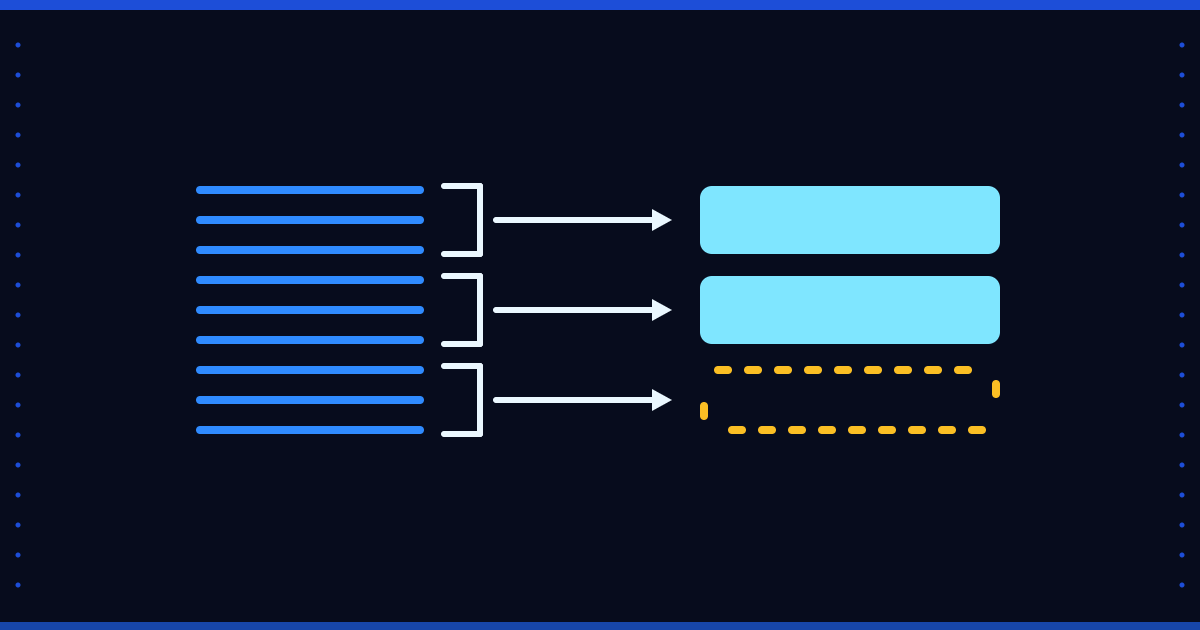
A slow report often re-sums raw rows on every open. How pre-aggregated tables work, what freshness costs, and what Floemdata does and does not have today.
What should you measure so the AI bill is no surprise? Tokens, caching, retries and cost per business outcome, as a measurement plan that invents no prices.
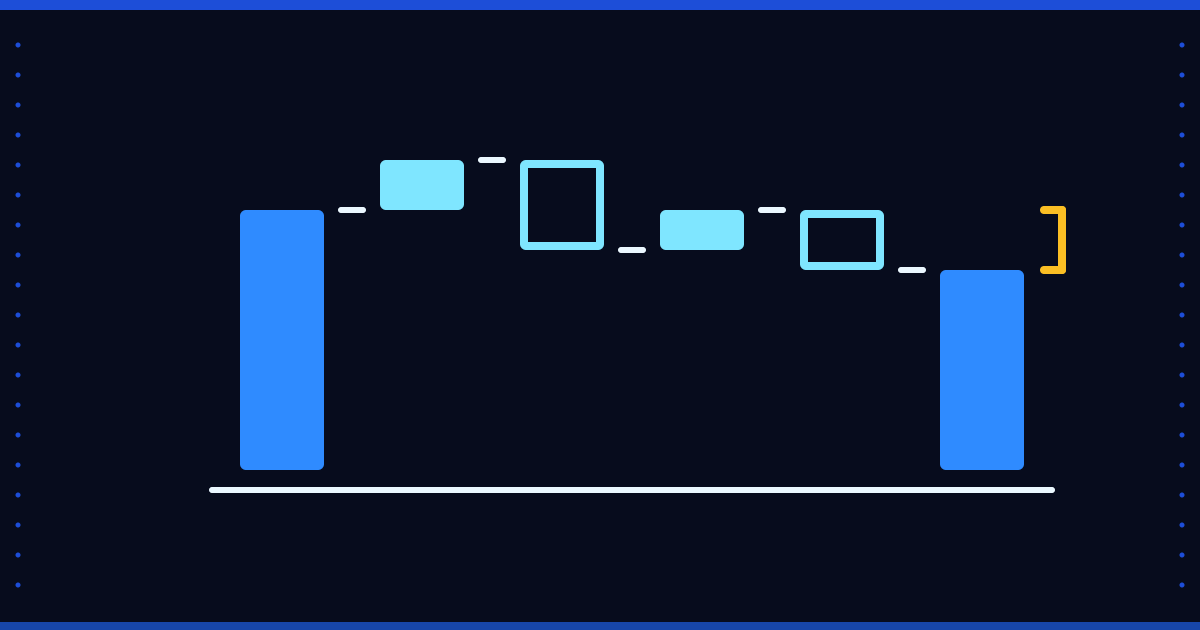
The gap between budget and actual says little on its own. Sign rules, the percentage trap, price and volume splitting, and where Floemdata stands on budgets today.
How long should you keep data? Steps to frame retention, archiving and deletion; ask your legal adviser about statutory periods. Floemdata's current status.
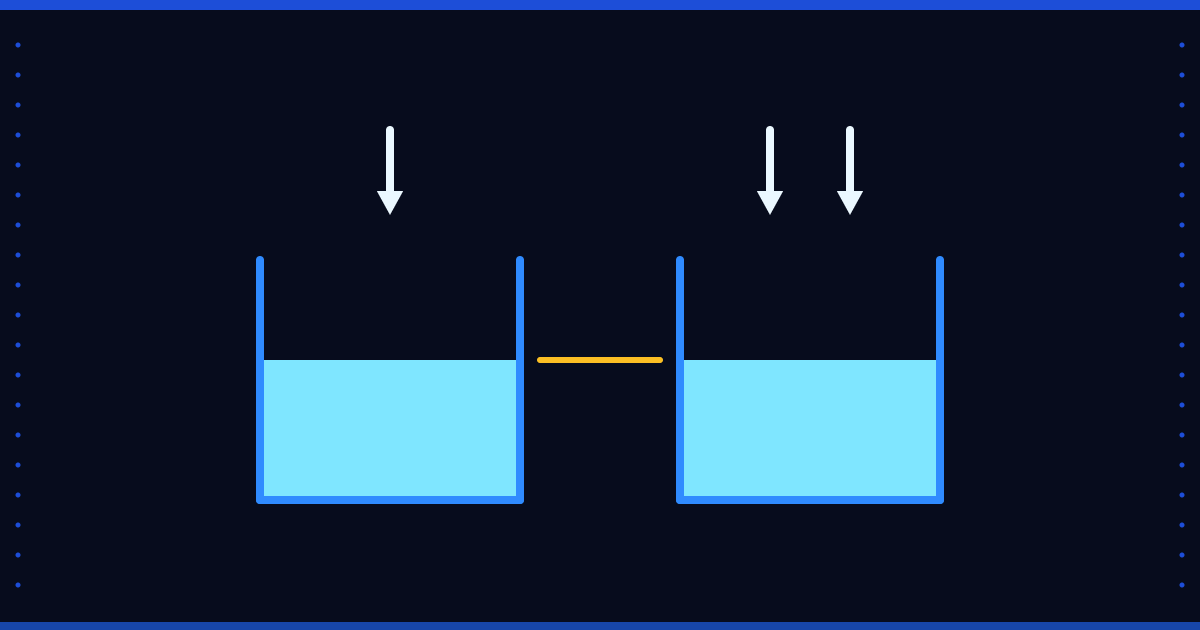
A data load that is interrupted and restarted must not double your rows. Unique keys, upserts and versioning, plus what we found and did not find in Floemdata.
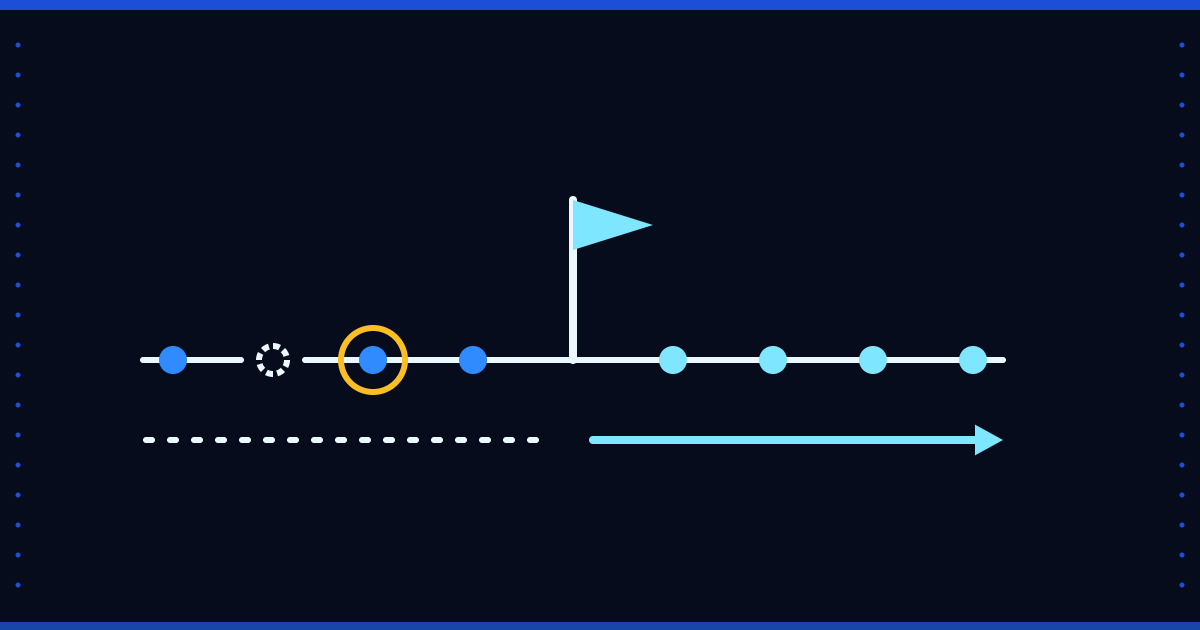
Incremental loads are fast but silently miss deleted and back-dated records. How watermarks, overlap and full reloads help, and what Floemdata does today.
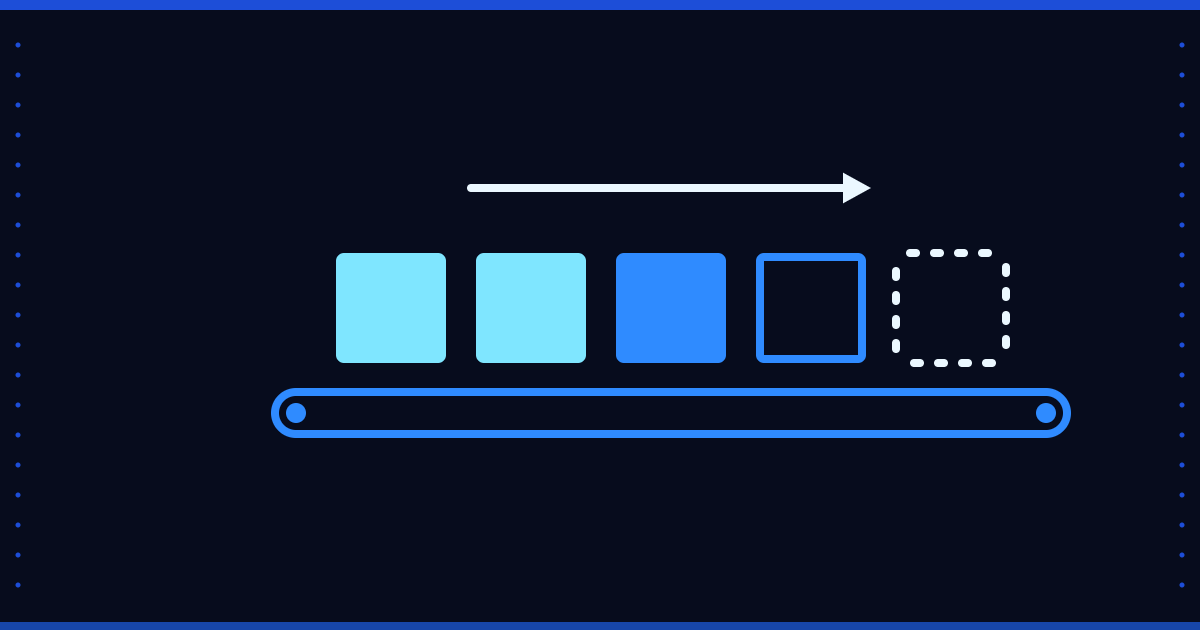
Inventory turnover and ageing ask the same question in two ways. Formula choices, average-stock and days-idle traps, and the definitions Floemdata actually uses.
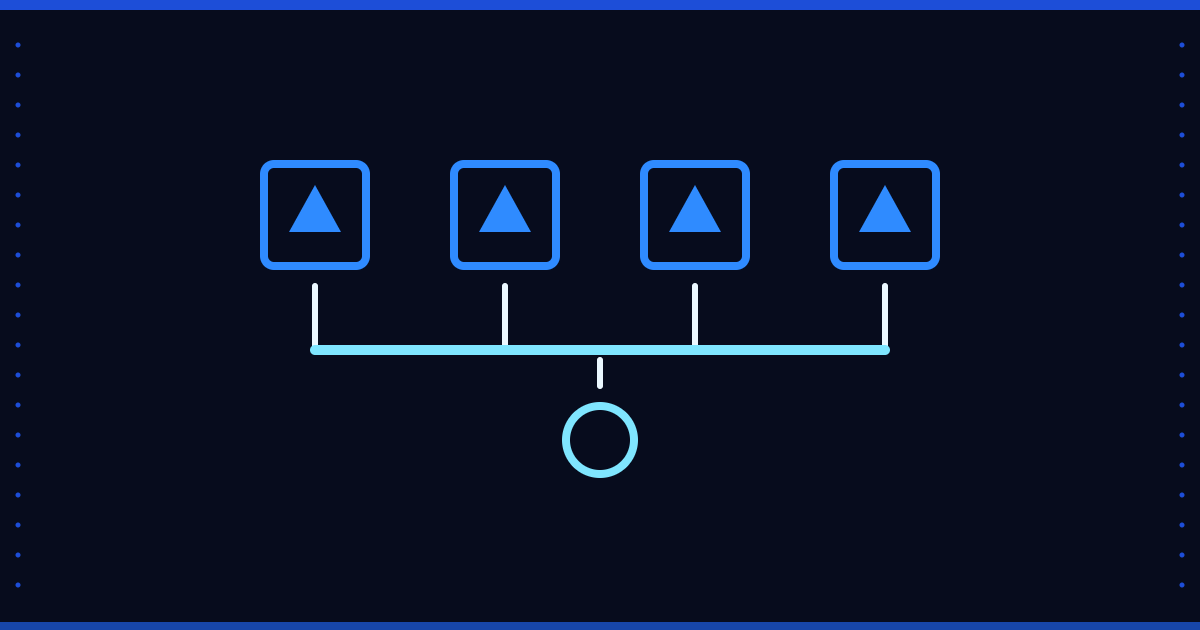
Two reports, two revenue figures: the definition is the problem. A KPI glossary with one definition, one owner and version notes, and Floemdata's measure catalog.
When one customer sits in your ERP under two codes, reports rank them wrongly. Three steps to find duplicate records, a mapping table, and Floemdata's real status.

From gross to net sales: how returns and cancelled documents distort the number, checks that prevent double counting, and Floemdata's real status.
Which alerts do you really need? A minimum monitoring set for data freshness, row-count drift and run errors, and where Floemdata's monitoring stands today.
RAG lets an AI answer from company documents and cite its source, while a data warehouse computes the numbers. The difference, and which job suits which tool.
What does splitting open receivables into overdue buckets show, and what does it hide? How to read the buckets, common mistakes and Floemdata's ageing table.
A euro invoice is paid in lira and the reports show two different amounts. What to watch in SAP B1 when reporting rates, foreign amounts and exchange differences.
Company-specific U_ fields in SAP B1 hold some of the most valuable and most fragile reporting data. How to find them, clean the values and move them to a warehouse.
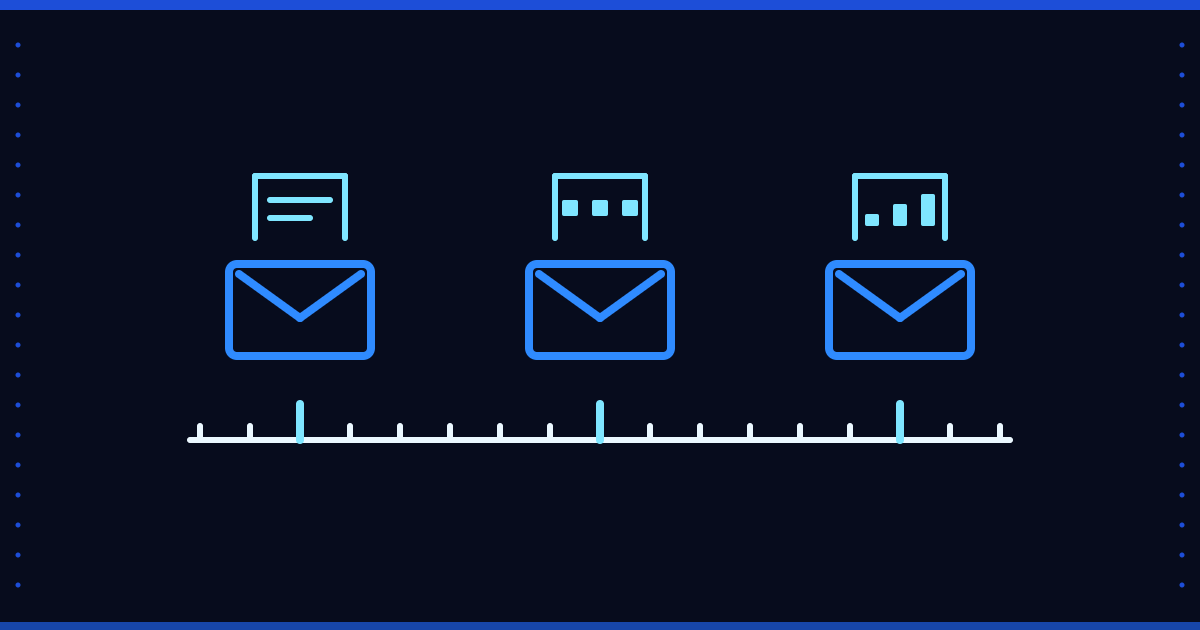
Every morning, or only when needed? Recipient, timing, format and data-freshness decisions behind scheduled delivery, and where Floemdata stands.
A column is added, dropped or renamed in the source system. What should your data pipeline do that day? A data contract, three reactions and Floemdata's real status.
If a customer code changes, what happens to past reports? The difference between surrogate and business keys, how to choose, and which key Floemdata uses today.
Synthetic data checks logic and consistency but cannot prove how a real system's schema and dirt behave. The limits, a documented example and the right order of use.
A sale made near midnight lands on the wrong day. UTC versus local time, daylight saving, dates without a time: traps that break daily figures.
A backup proves nothing until you restore it. Backups, restore tests, RPO and RTO for a small-business data warehouse, and what Floemdata does and does not cover.
End-to-end automation chains the steps from data extraction to report without manual work. We explain where approval is essential and where to stop.
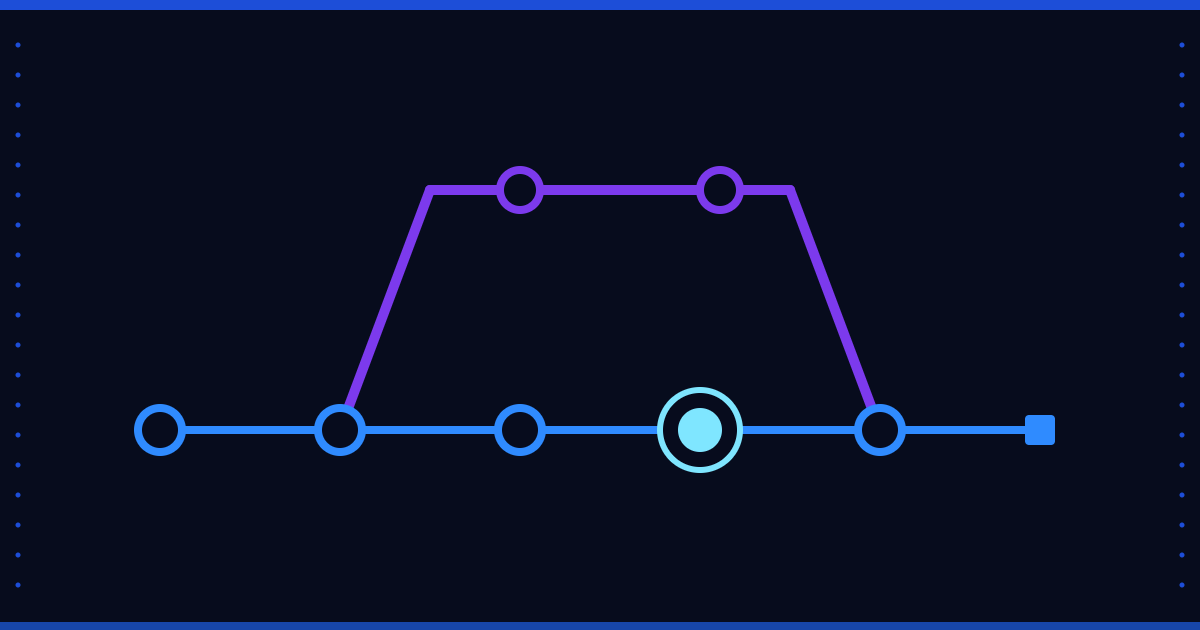
Why version an AI model in production and be able to roll it back? We explain how to keep model, data and code versions together.
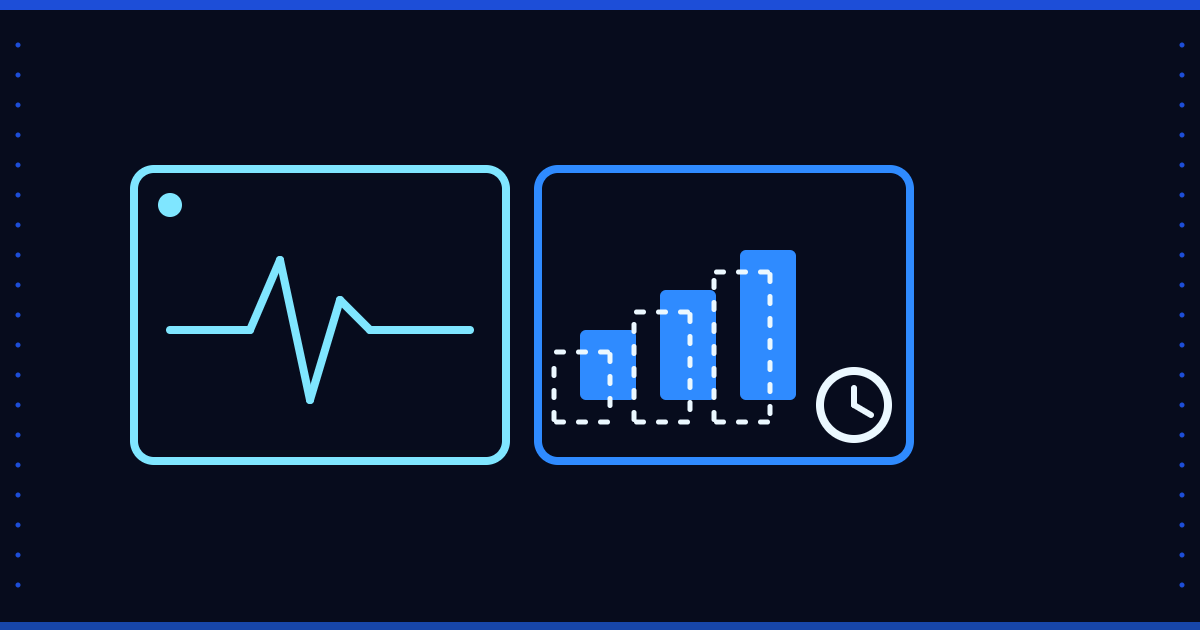
A live query is accurate but slow, a cache is fast but can be stale. We cover the balance between speed and accuracy and when caching is safe.
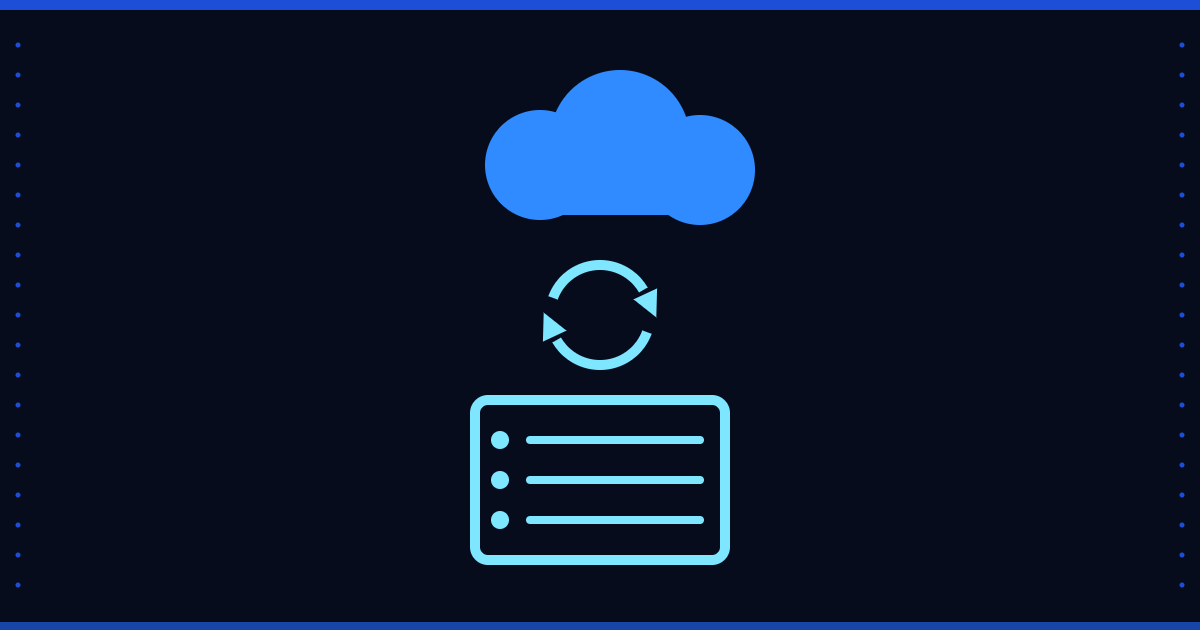
How do you set up synchronization when data lives both on premises and in the cloud? Direction, latency, conflicts and security for hybrid setups.
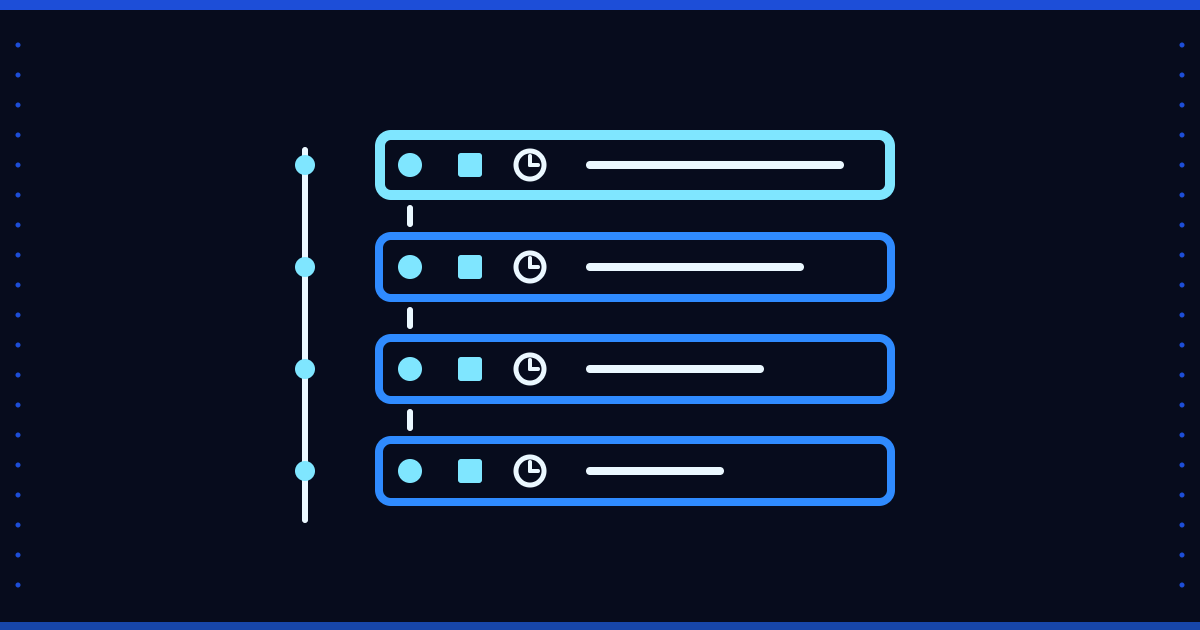
A data audit trail lets you show later how a number came about. We cover which records to keep and what to watch for compliance. Not legal advice.
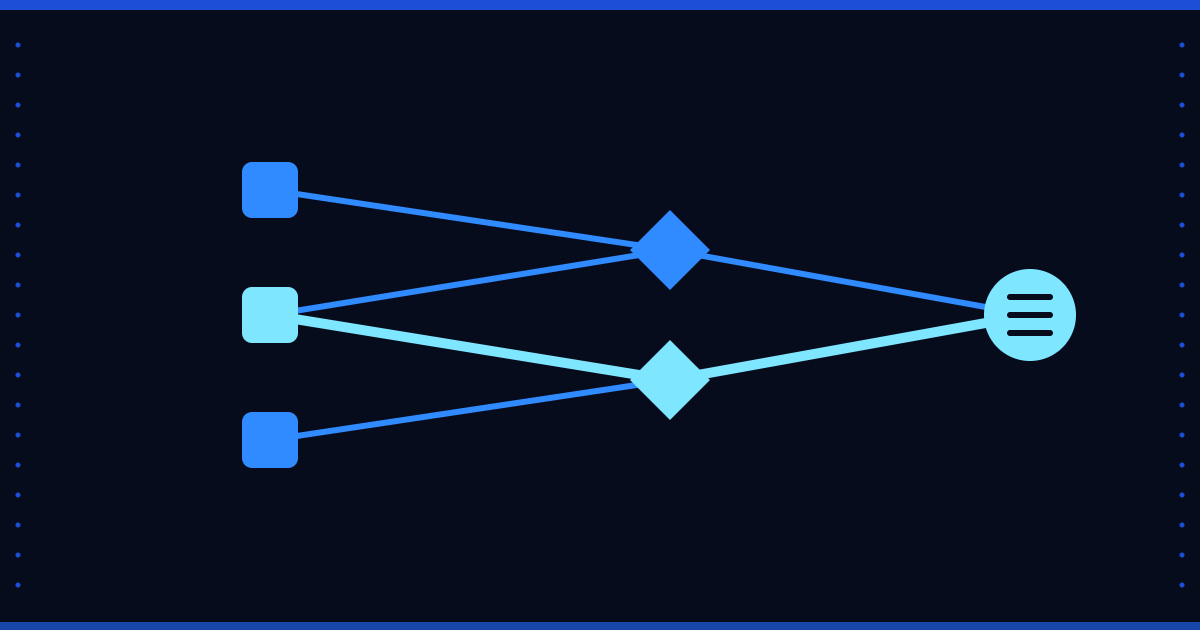
Data lineage shows which steps a number passed through from source to report. We explain why it matters and how to start.

Improve the model or the data? We explain how data quality affects model performance and when to invest in which first.
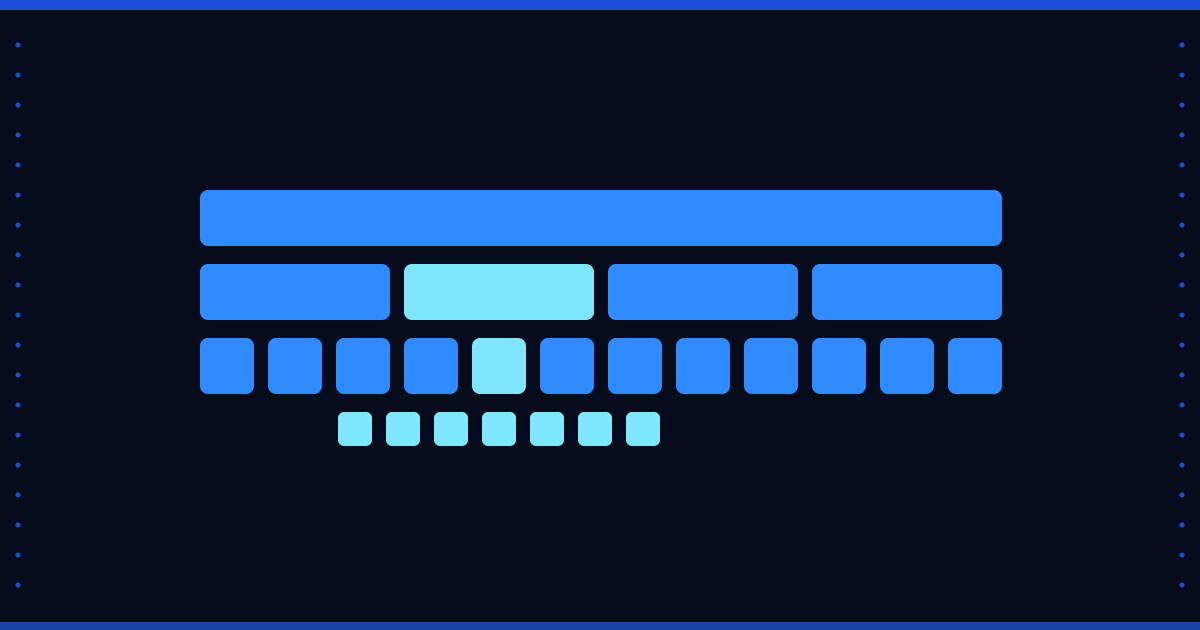
Should a report's date dimension be day, hour or minute? We explain how granularity, time zones and calendar differences change a number.
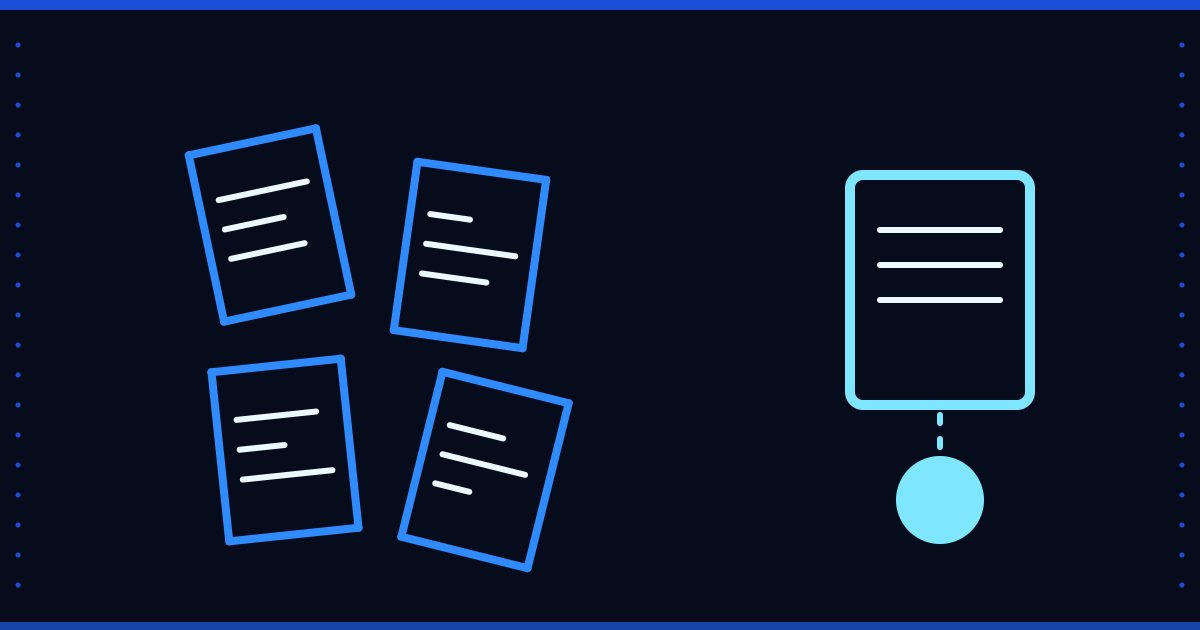
Excel is flexible, a system report is consistent; which is right when? We compare version chaos, formula errors and a single source of truth.
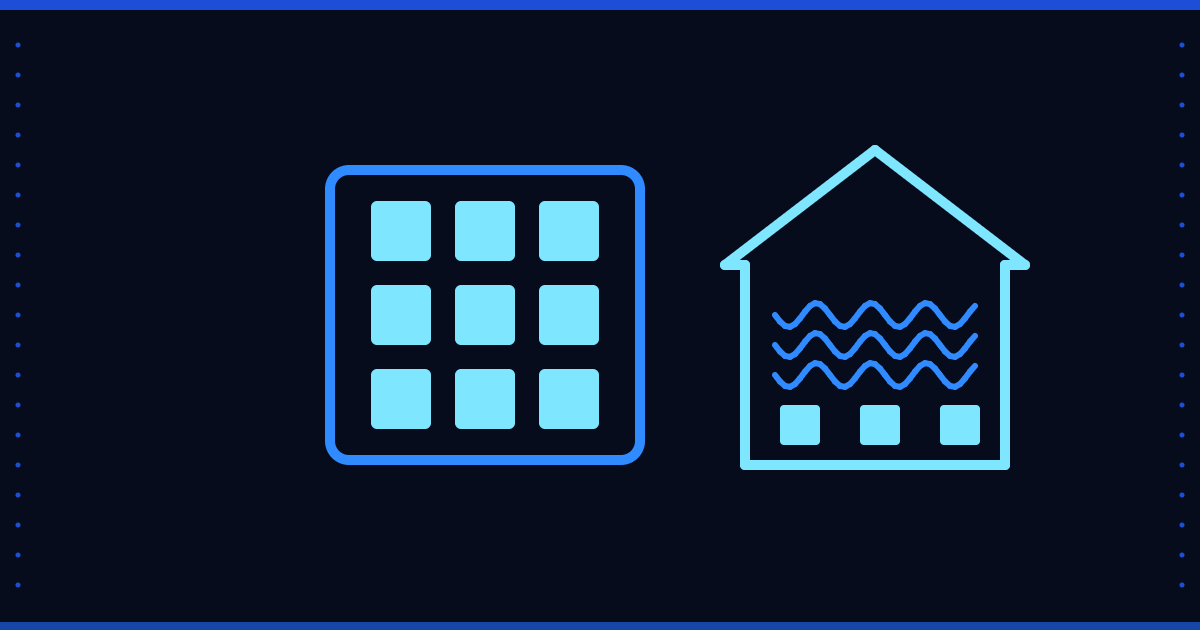
Lakehouse or classic data warehouse? We explain how the two architectures differ and why a small company should start simple.
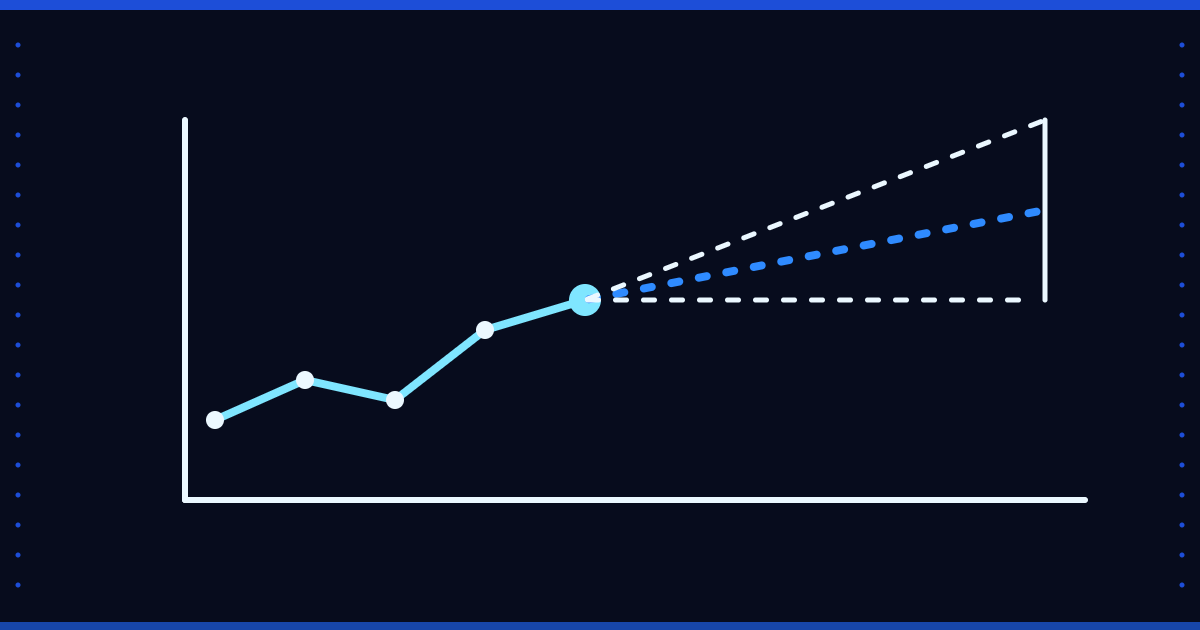
Why seasonality and payment behavior matter in cash flow forecasts. We cover starting simple, how to check a forecast against actuals, and its limits.
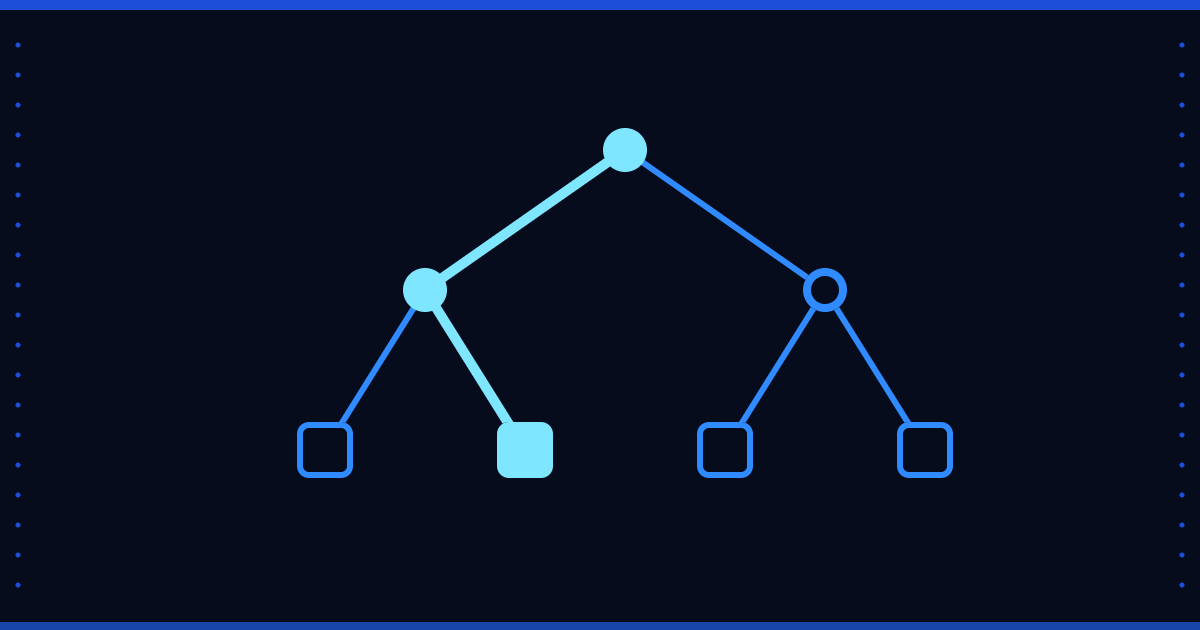
What to check before trusting AI output at work? A practical checklist on validation, explainability and human oversight, with a NIST reference.
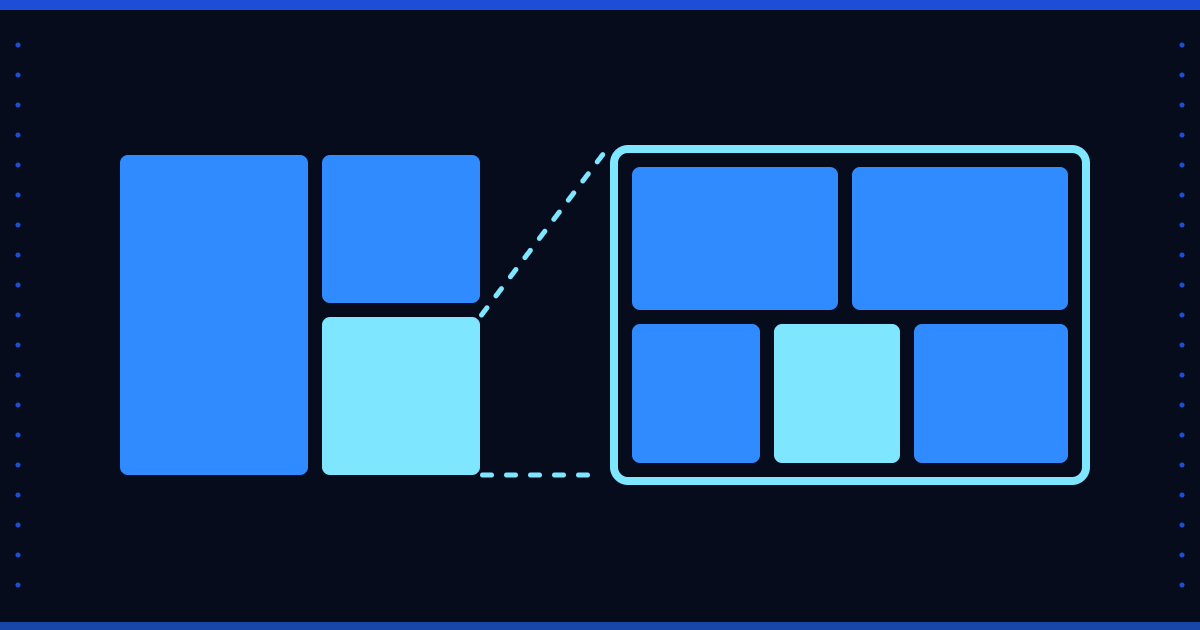
Drilling from summary to detail speeds up a BI dashboard. We cover design principles and what to watch when choosing the order of dimensions.
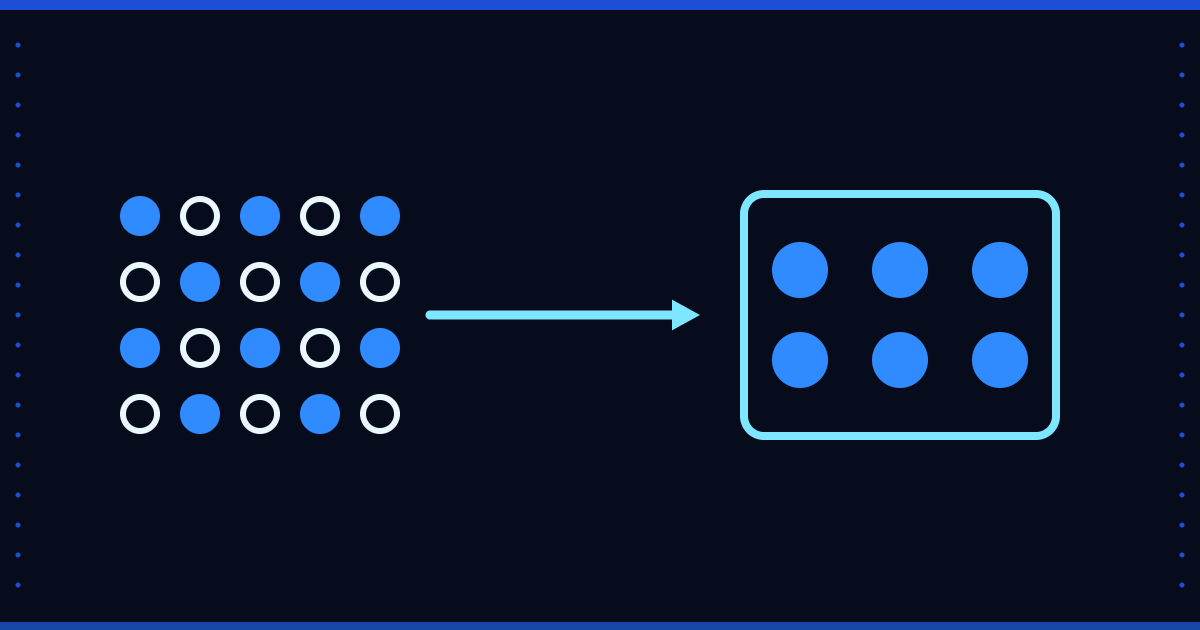
Reports can mislead even with correct numbers: Simpson's paradox, truncated axes, averaged ratios. We cover common traps with fictional examples.
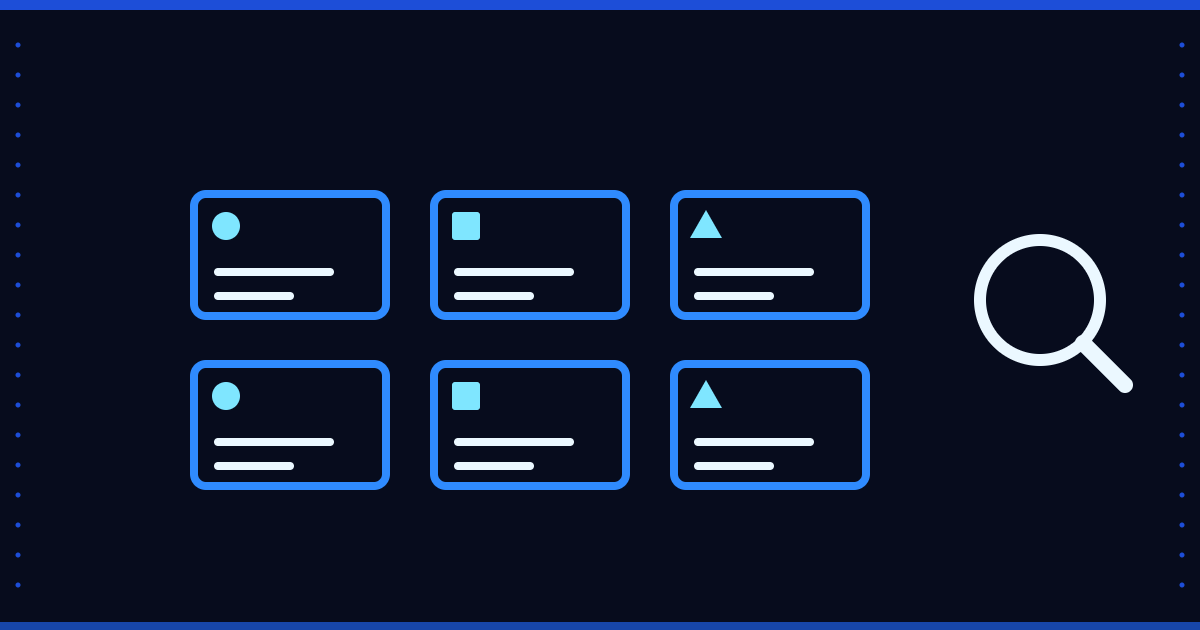
A data catalog records where data lives and what it means. We explain the metamodel behind it and how a small team can start.
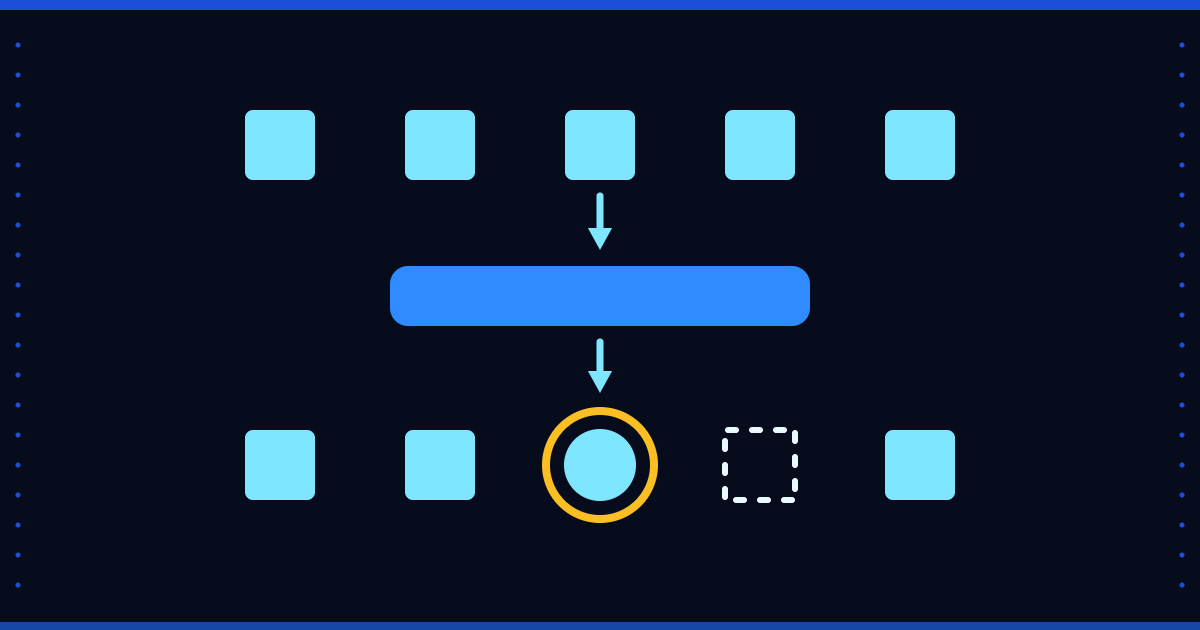
Errors in data extraction and transformation are unavoidable; what matters is being able to go back. Re-runnable loads, confirmed progress and month-end close.
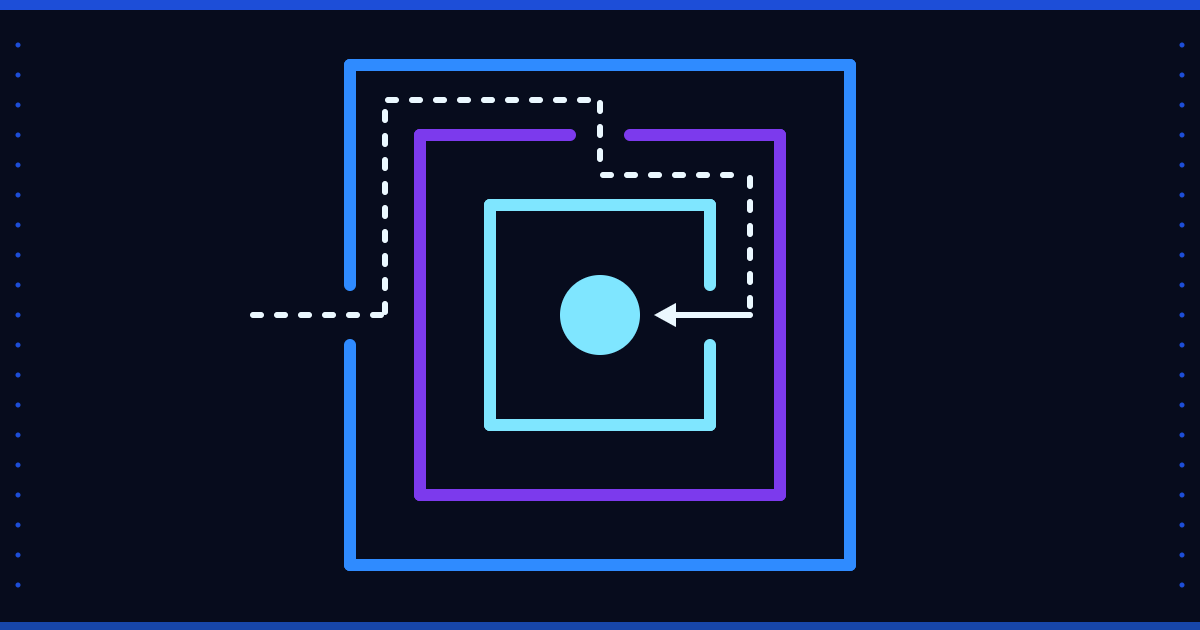
How much protection does financial data need? A risk-based look at signing versus encryption, connection security and access rules. Not legal advice.
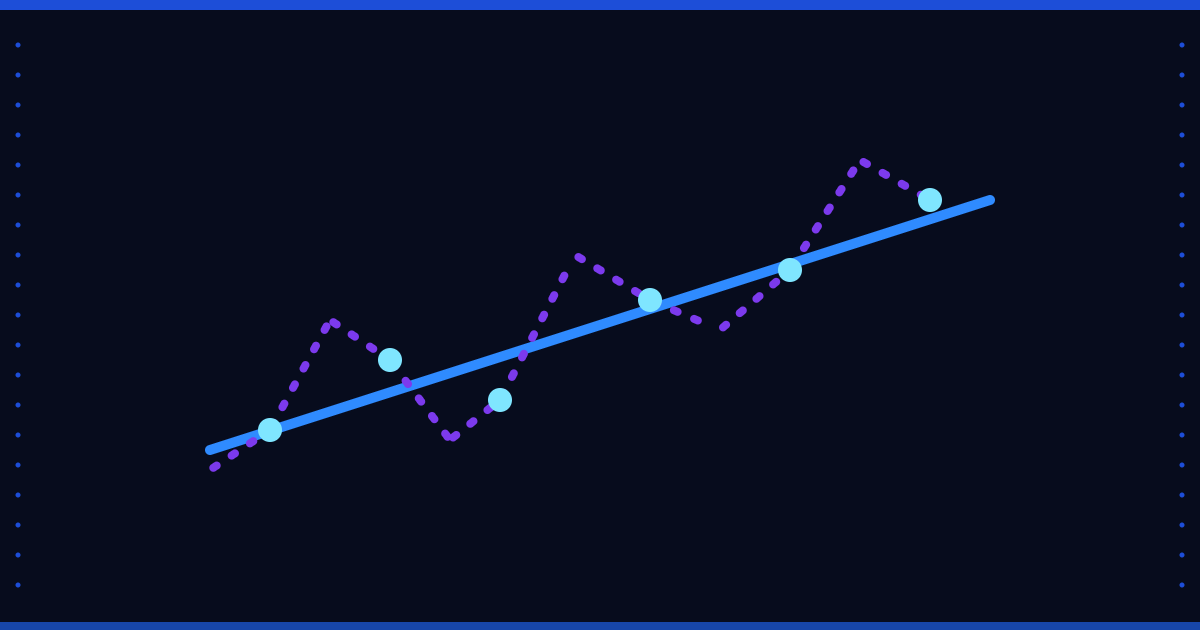
Is machine learning possible with little data? A simple baseline first, careful validation next: when to start and when to wait.
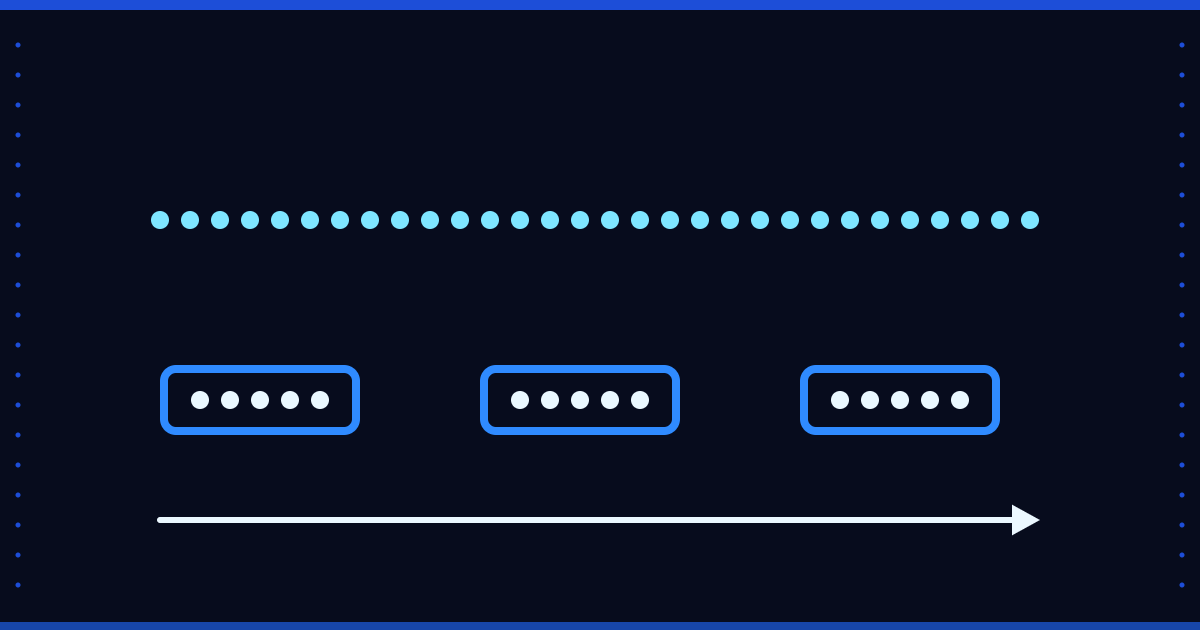
Real-time stream or hourly batch pull? We explain how to pick the right refresh rate for SAP B1 data from latency, system load and decision needs.
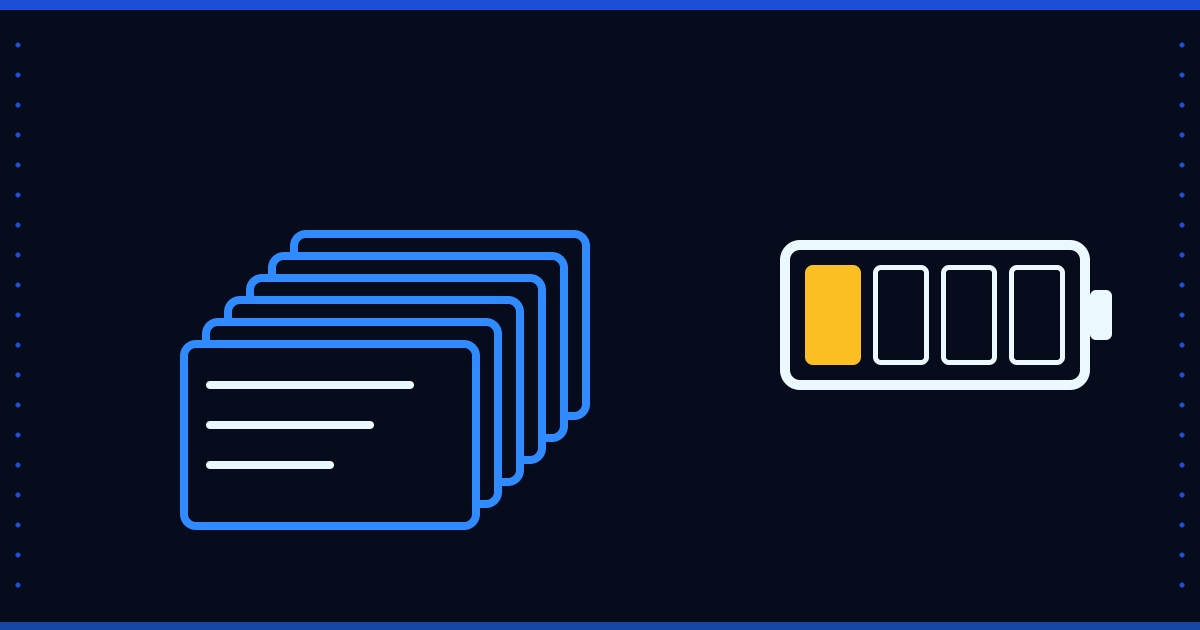
Too many reports wear a team out: nobody knows which one to look at. We cover a report inventory, shared definitions and alert-focused dashboards.
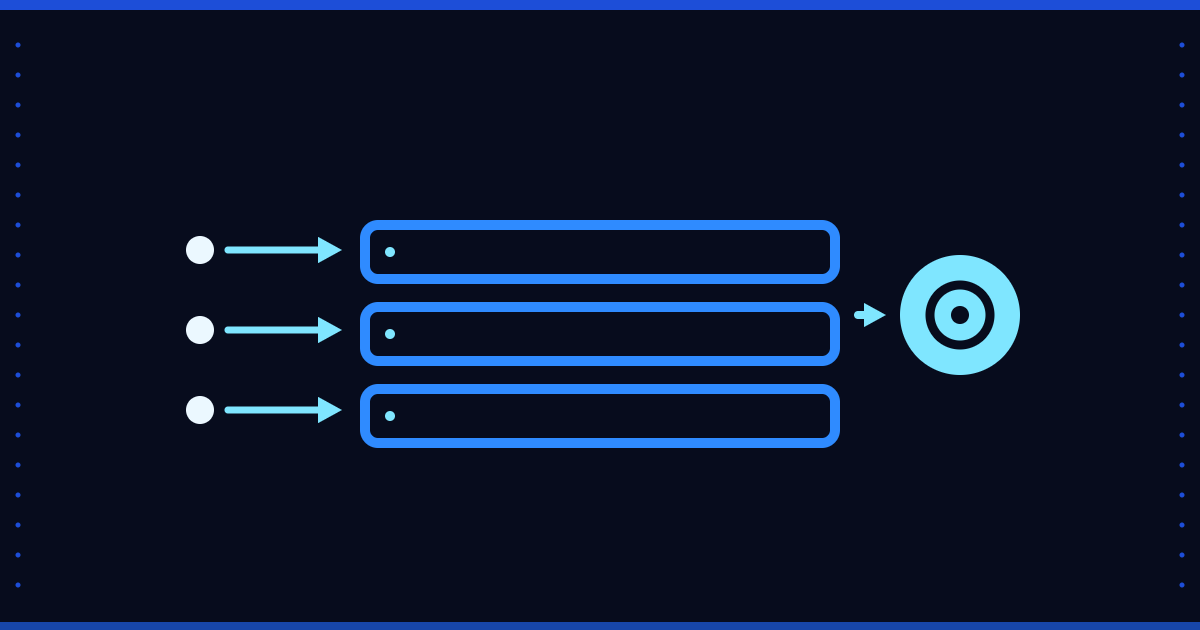
AI can support forecasting, anomaly detection and automation in a data warehouse. We explain what must be in place first, and where the limits are.
Personal data in BI reports should be considered under Turkish KVKK. We explain the data security duty and access-rule design. Not legal advice.
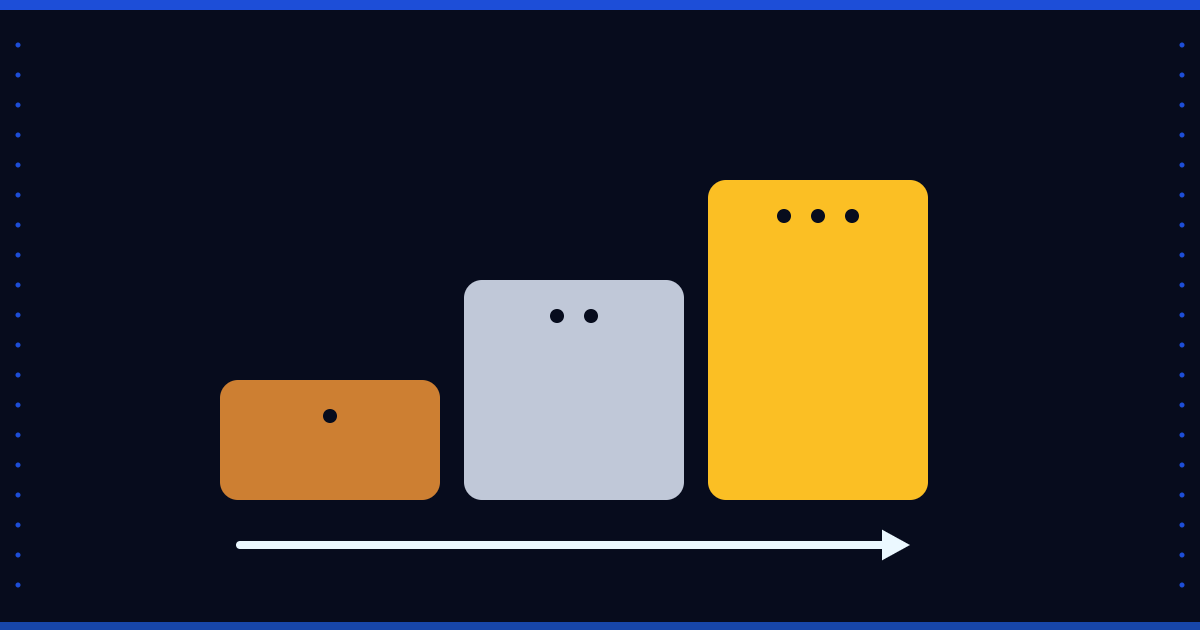
Bronze, Silver and Gold layers organize data from raw form to report. We explain what each layer does and how it appears in Floemdata Analytics.
A checklist for data quality: completeness, uniqueness, validity, consistency. We show which checks should be automatic and which need a person.
A BI measure should be defined once, in one place: sums, ratios, time dimensions and filters. We explain the catalog approach and traps such as working days.
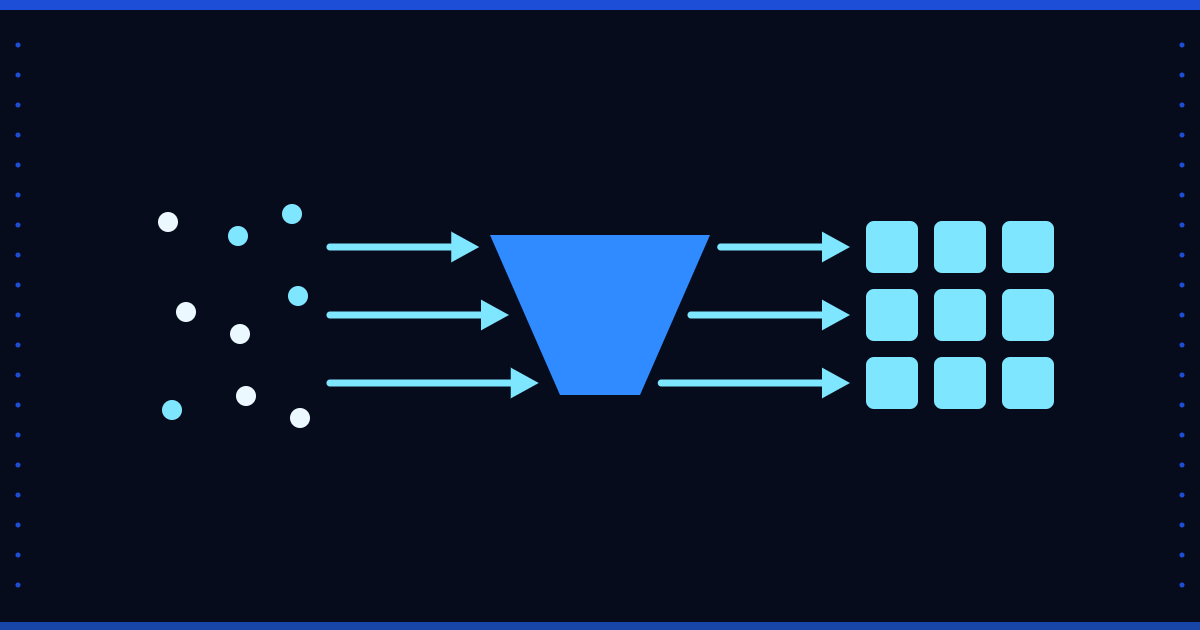
ETL moves data from several sources into a warehouse and transforms it. We explain when it is needed, when it is extra burden, and how it differs from ELT.
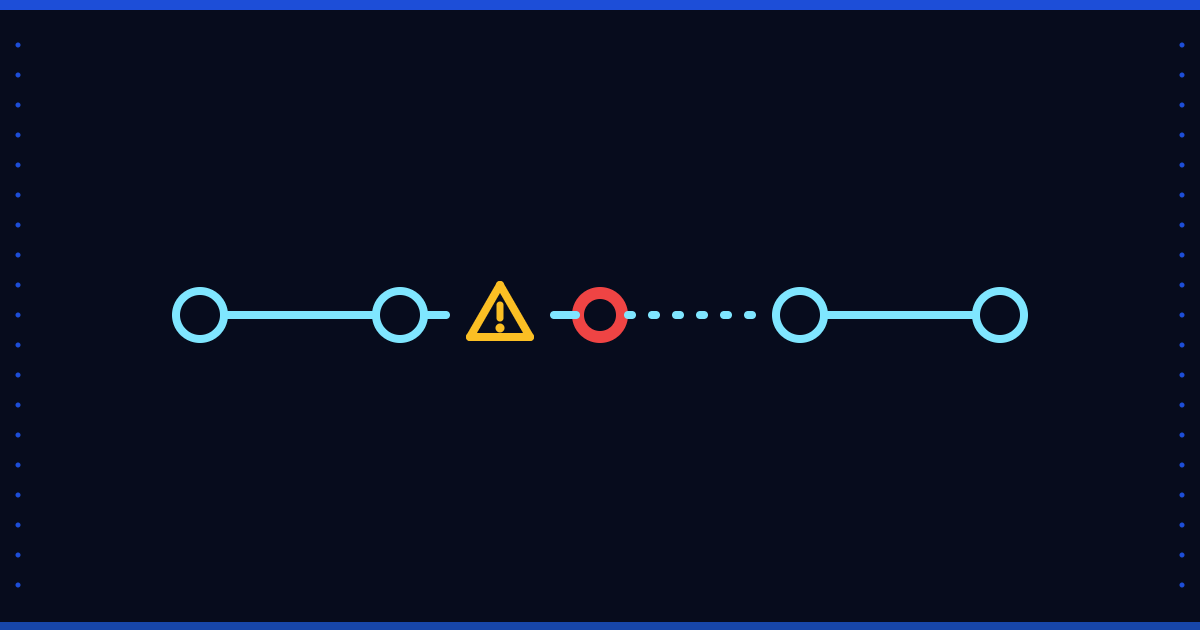
Five common mistakes in business use of AI tools, each with a fix: confidential data, unchecked output, leaving the math to the model, and more.
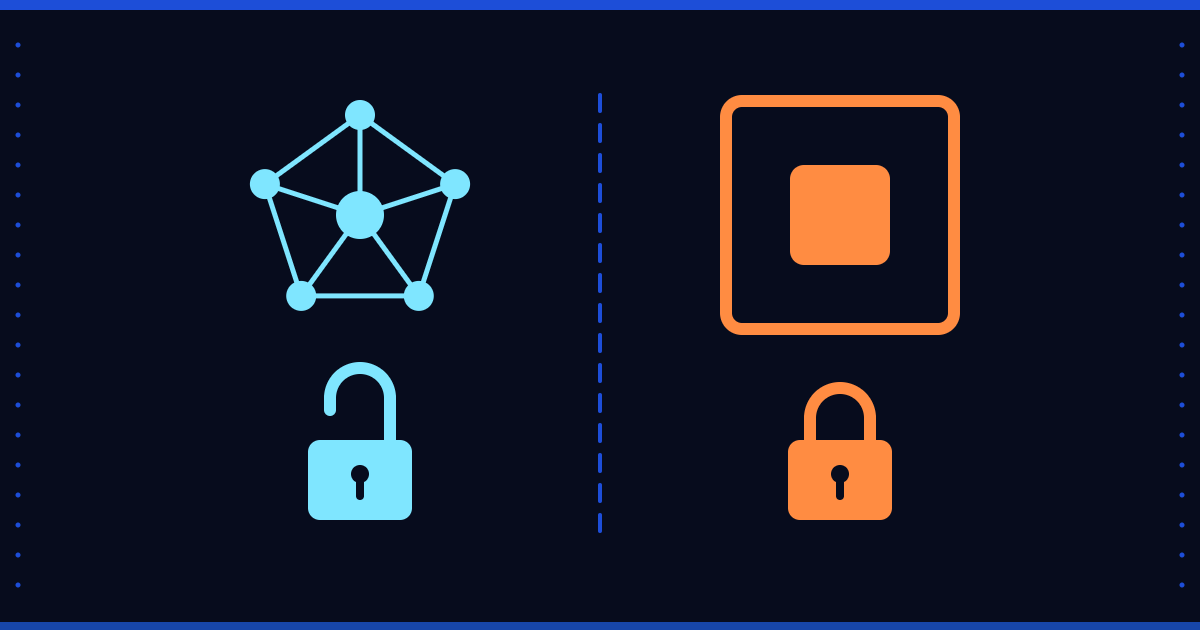
Llama passed one billion downloads, while Meta's Muse Spark, announced in 2026, is closed according to CNBC. We compare open and closed approaches.
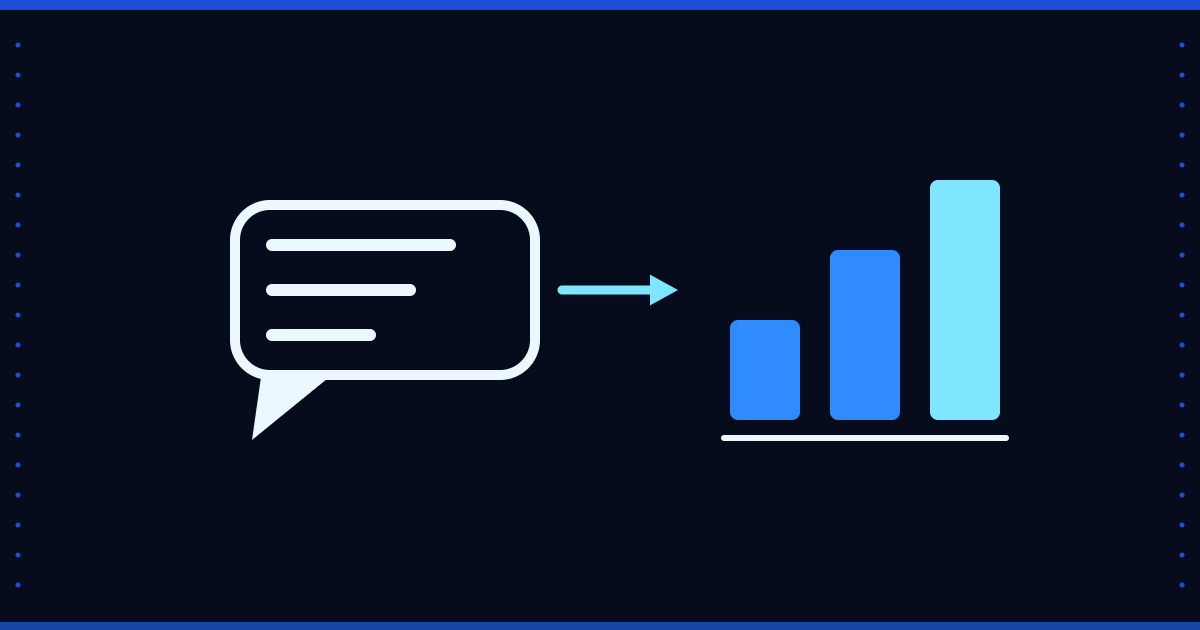
Asking questions in plain language makes BI easier, but a model can invent numbers. We explain why turning the question into a validated report definition is safer.
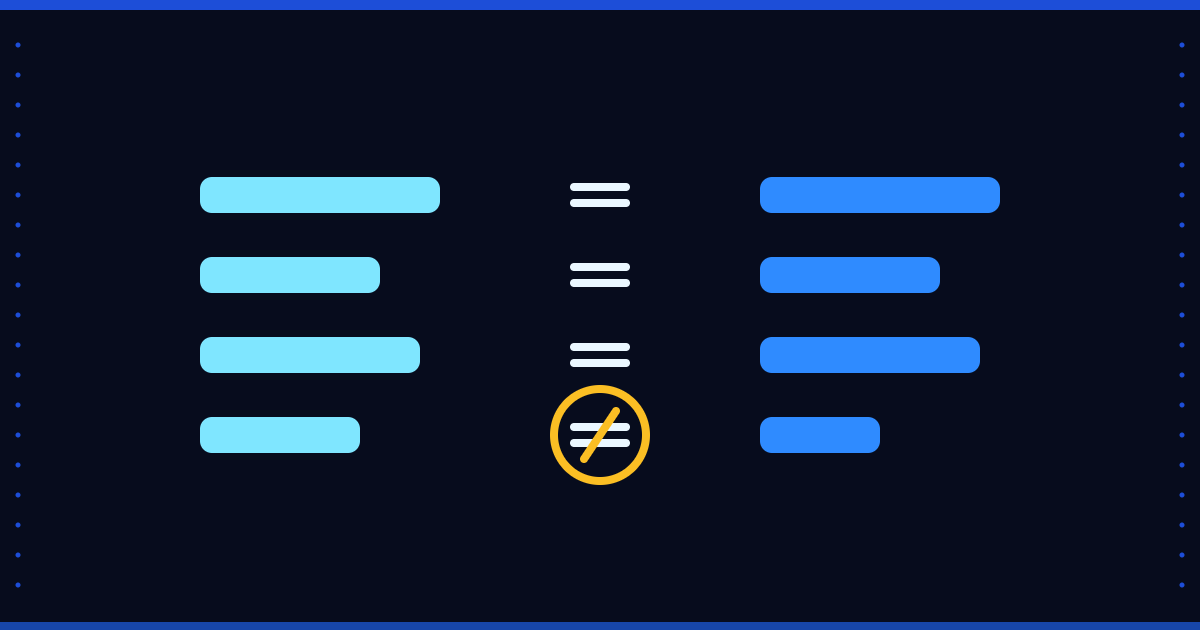
Does the report match the source system? We describe a two-layer reconciliation and why a difference should be shown, not hidden.
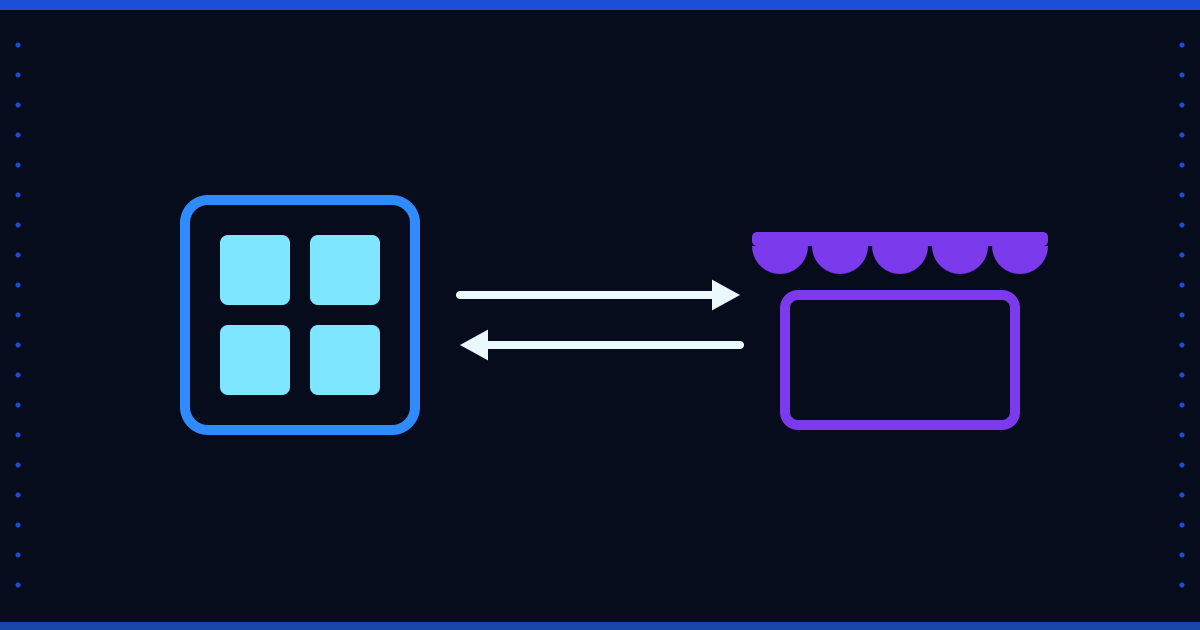
Combining SAP B1 and marketplace data in one warehouse is harder than it looks: different keys, returns and cancellations, reloads and reconciliation.
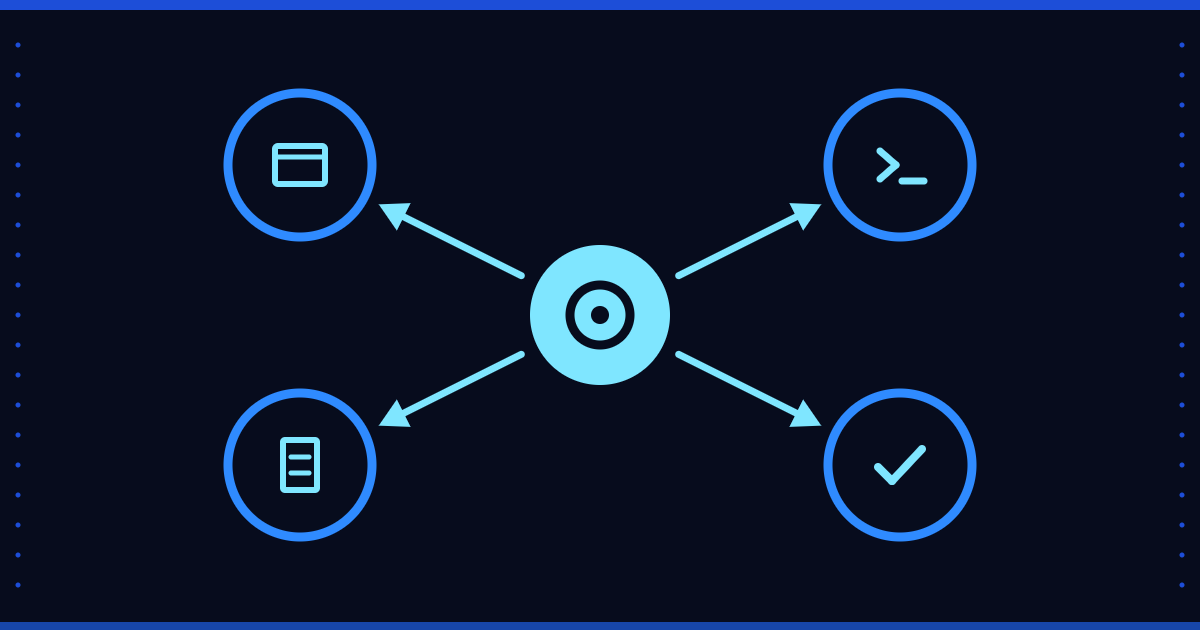
Agentic AI goes beyond chat by carrying out tasks. We explain how multi-agent setups work and where businesses could use them.
Anthropic announced a $65 billion Series H in May 2026, and Andrej Karpathy joined the company. A sourced summary of the numbers and context.
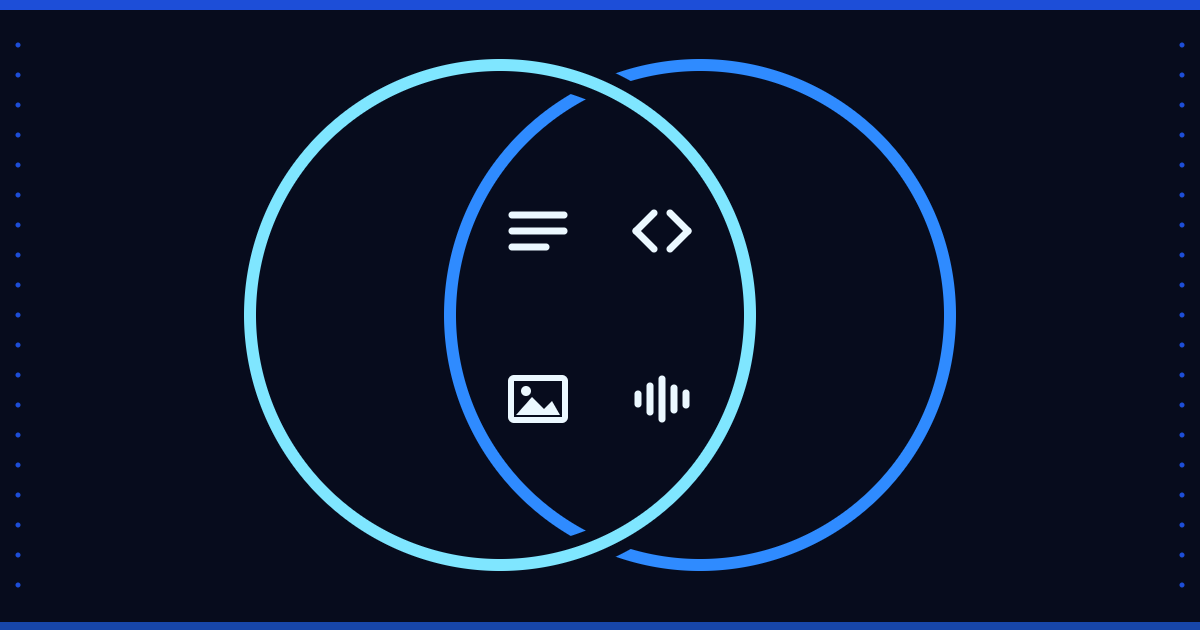
How to choose between Claude and ChatGPT: task type, data terms, cost, and a test on your own tasks instead of a leaderboard.
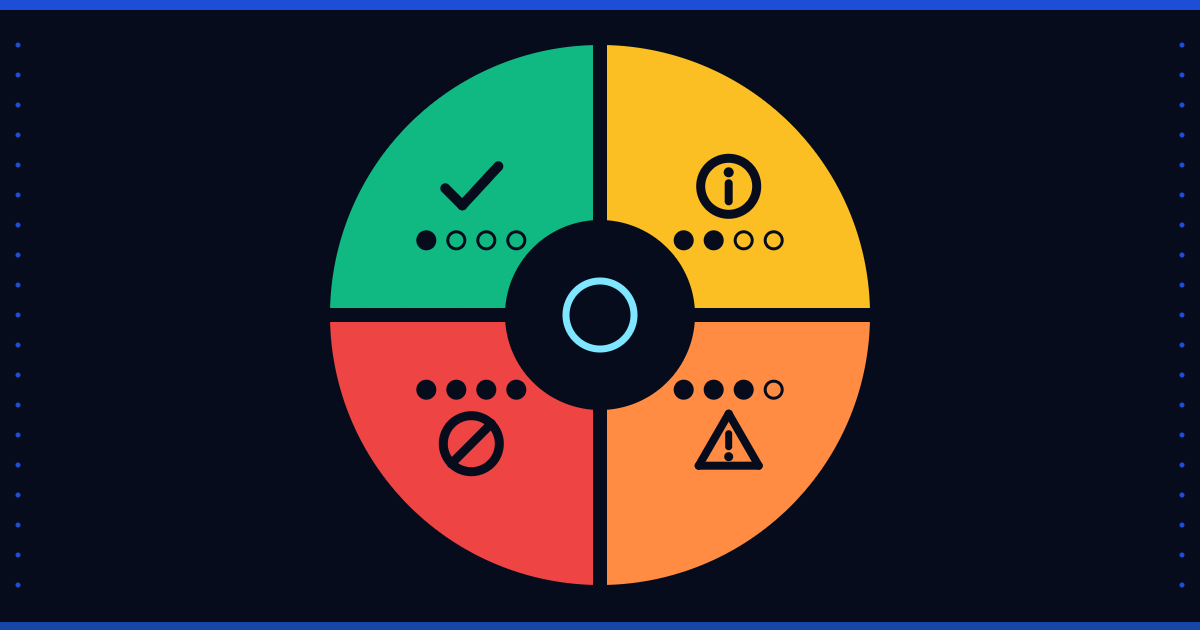
The EU AI Act's high-risk obligations were postponed. We outline the four risk levels and what applies in 2026, with dates.
Why hand-set thresholds go stale, why median and MAD beat mean and standard deviation, and why a rule should stay silent without enough history.
What business intelligence means, how it differs from plain reporting, the usual stack, and why the semantic layer decides if dashboards can be trusted.
Data science versus data analytics, the four levels of analysis, and what has to be true about your data before any model is worth building on top of it.
What data integration means, how data moves out of an ERP into a warehouse, and the hidden cost of exporting to spreadsheets by hand every single month.
What SAP Business One covers, which tables hold its data, and why reporting needs a separate layer rather than queries against the live database.
The three steps of ETL, how it differs from ELT, incremental loading and idempotency — plus the part that decides whether anyone trusts the result.
Power BI components, Import versus DirectQuery, where the data model should come from, and why connecting it straight to your ERP tends to backfire.
Descriptive, diagnostic, predictive and prescriptive analytics explained — and the order that actually works for mid-sized companies starting out.
Why letting a model query production directly is risky, and the pattern where AI fills in report definitions instead of writing SQL or doing arithmetic.